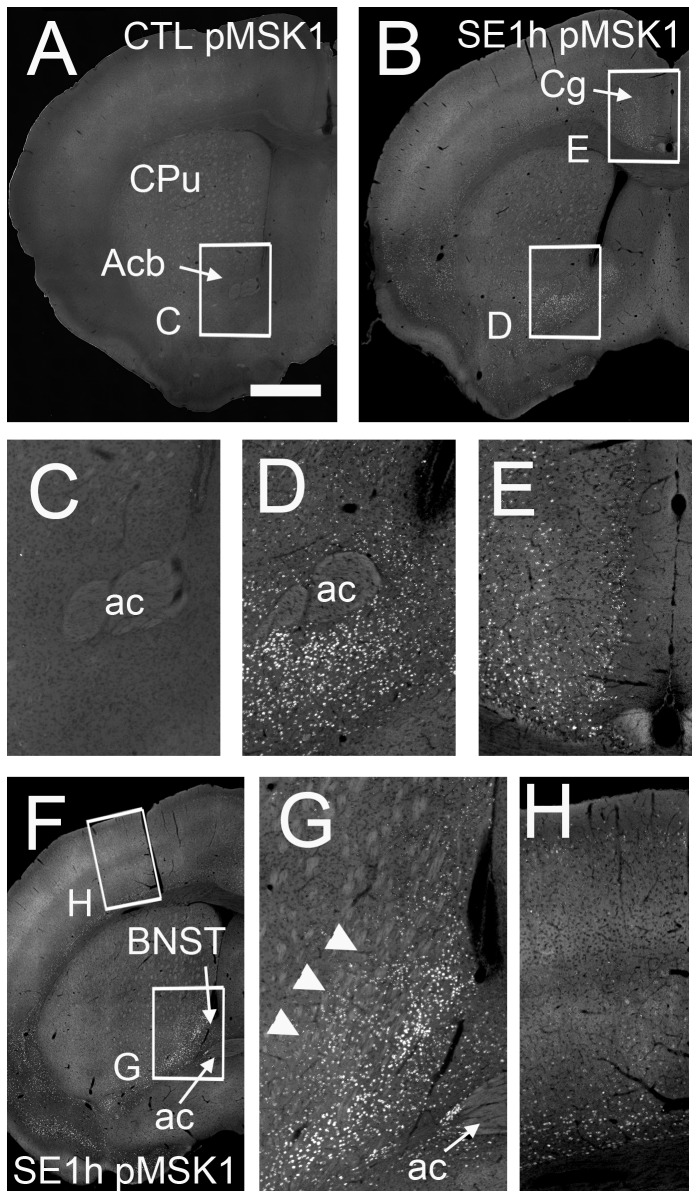
Figure 5. MSK1 is phosphorylated in the pilocarpine-induced SE brain at 1 h.
Stacked epifluorescence microscopy images of the anterior (A-E) and middle (F-H) part of the brain of the control (A and C) and SE 1 h group (B and D-H) are shown. High magnification images of the Acb (C and D), Cg (E), BNST (G), ventral limb of the CPu (arrowheads, G), and the somatosensory cortex (H) are shown. (A and C) In the control brain, there are virtually no phosphorylated MSK1+ (pMSK1+) cells. The distribution of pMSK1+ cells is similar to that of PH3+ neurons in the SE brain at 1 h (see Figure 3 and Figure S5). Note that there are fewer pMSK1+ cells in the CPu (G). Cg: cingulate cortex. Scale bar = 600 μm for A, B and F, and 150 μm for C-E and G-H.

