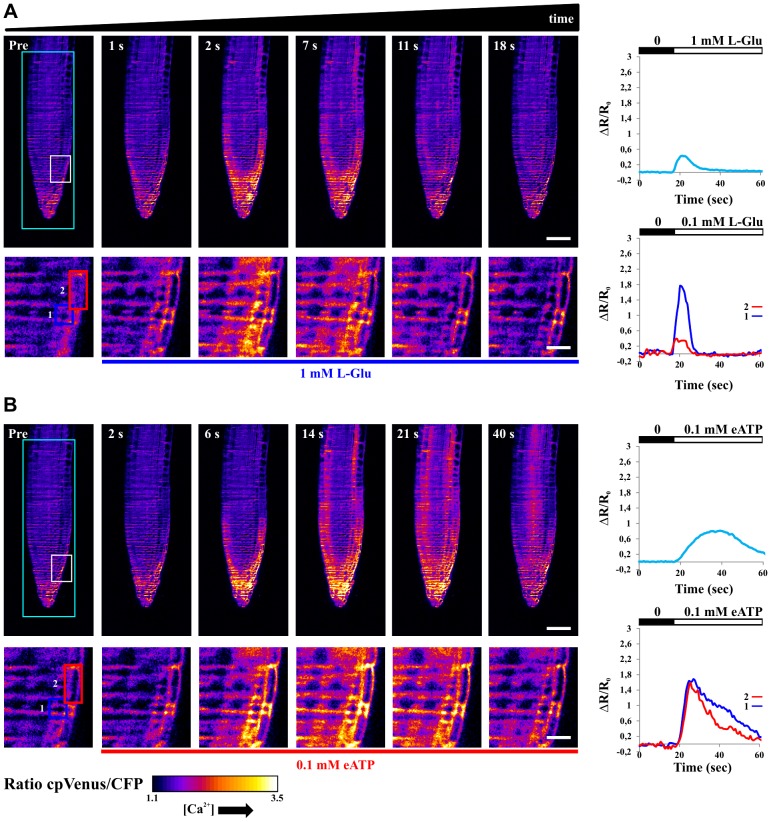
Figure 4. Single plane FRET ratio in root tip of Arabidopsis seedlings expressing the cytosolic localized Cameleon, measured at different times in the course of 1-Glu (A) and 0.1 mM eATP (B) stimuli.
(A) Upper images: FRET ratio measured at different time points from the sensing (Pre) of the L-Glu stimulus. Lower images: close up (white rectangle in the top-let image) of the same selected FRET ratios. Upper graph: temporal evolution of the FRET ratio for the entire region highlighted by the cyan rectangle. Bottom graph: temporal evolution of the FRET ratios for two selected cells (blue and red rectangles in the lower images). (B) Upper images: FRET ratio measured at different time points from the sensing (Pre) of the eATP stimulus. Lower images: close up (white rectangle in the top-let image) of the same selected FRET ratios. Upper graph: temporal evolution of the FRET ratio for the entire region highlighted by the cyan rectangle. Bottom graph: temporal evolution of the FRET ratios for two selected cells (blue and red rectangles in the lower images). Scale bar is 50 µm and 9 µm for low and high magnifications respectively.

