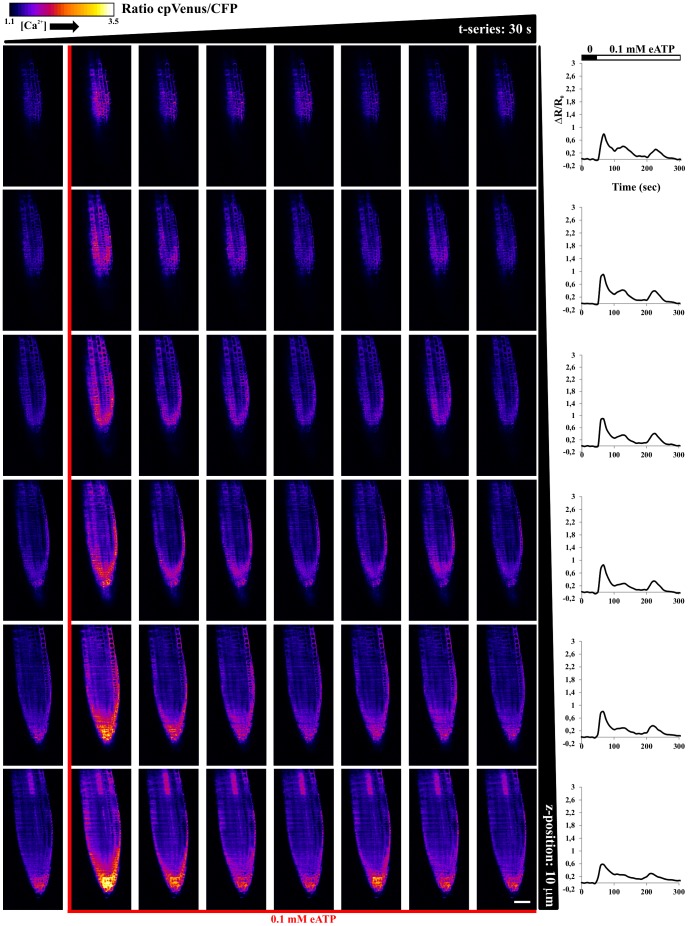
Figure 6. FRET ratio imaged in space and time, with 10 µm steps (columns) and every 30 s (rows), in root tip of Arabidopsis seedlings expressing the cytosolic localized Cameleon, in the course of 0.1 mM eATP stimulus.
Graphs on the right hand side report temporal evolution of the average FRET ratio for each single selected plane. Scale bar is 50 µm.

