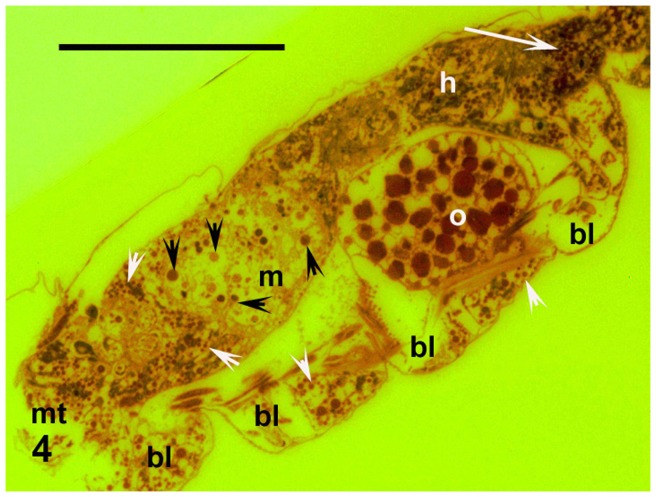
Figure 4. The entire animal.
Cyanobacterial cells in midgut (black arrowheads), mixture of concentrated cells and amorphous organic matter in hindgut (white arrow), and glycogen deposits in periphery (diverticula) of gut (white arrowheads), sagittal section. Fluorescence with emission spectra exceeding 515 nm, colours inverted, orange G staining. Abbreviations used: bl = diverticula of the gut in bases of the legs, h = hindgut, m = mesenteron or midgut, mt = mouth area, o = egg. Scale bar = 0.1 mm.

