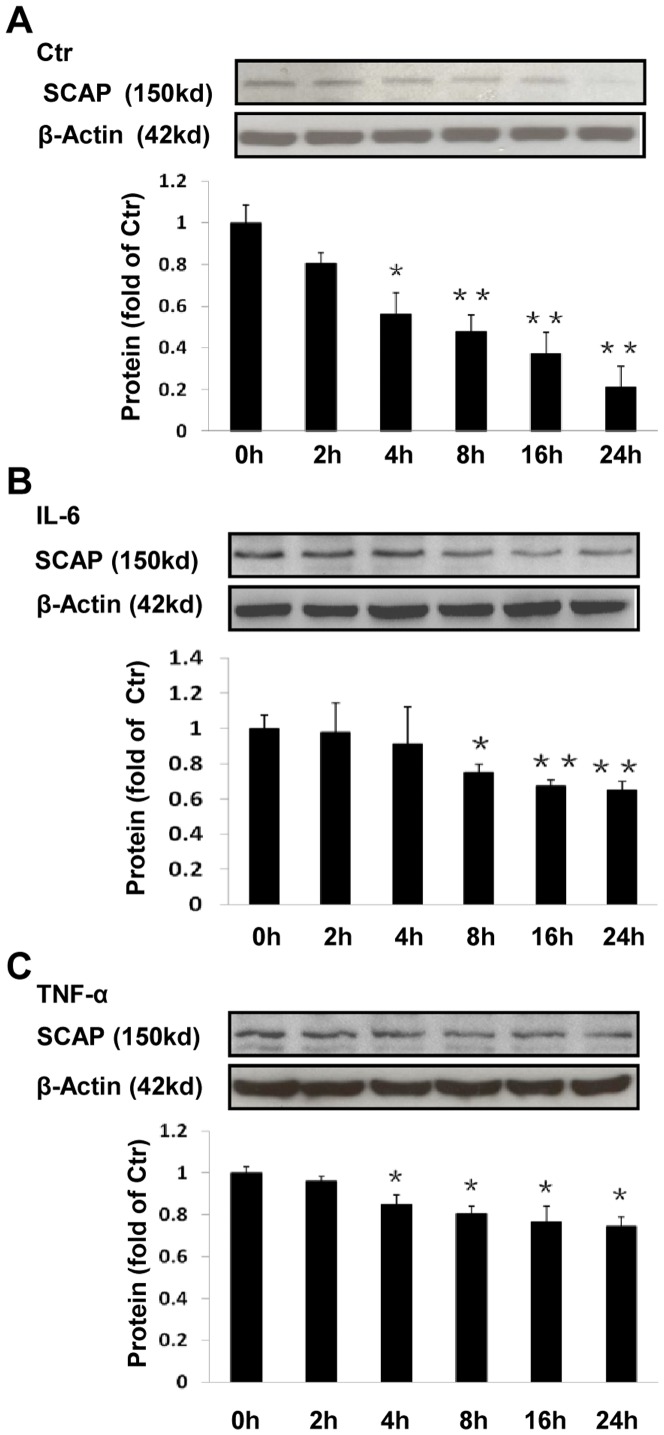
Figure 6. Effects of inflammation on SCAP stability in THP-1 macrophages.
The cells were treated with or without 40/ml IL-6 or 50 ng/ml TNF-α for 24 h, and then chased in the presence of 50 µmol/l CHX for 0, 2, 4, 8, 16 and 24 h. The cells were lysed in equal volumes of buffer and protein levels plotted as a percentage of the SCAP remaining compared with the amount at 0 h. The histogram represents mean± SD of the densitometric scans of SCAP protein bands from 4 experiments, normalized to β- Actin and expressed as a percentage of control. *P<0.05 vs 0 h; **P<0.01 vs 0 h.

