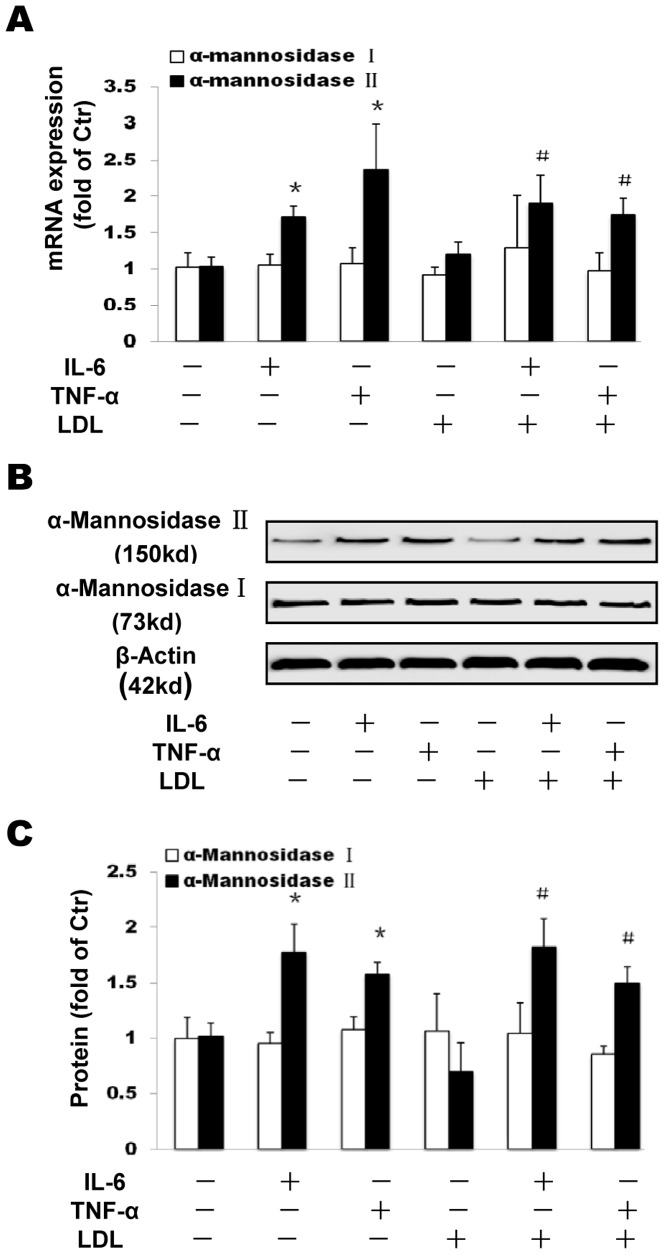
Figure 7. Effects of inflammation on Golgi enzymes α-mannosidase I and α-mannosidase II expression in THP-1 macrophages.
THP-1 macrophages were incubated in serum free medium for 24 h at 37°C. The medium was then replaced by fresh serum-free medium in the absence (control) or presence of 40 ng/ml IL-6 or 50 ng/ml TNF-α or 25 µg/ml LDL alone or 40 ng/ml IL-6 plus 25 µg/ml LDL or 50 ng/ml TNF-α plus 25 µg/ml LDL for 24 h at 37°C. mRNA levels were determined following the ΔΔ threshold cycle (Ct) protocol for real time RT-PCR as described in the Materials and Methods section. β-Actin served as the reference gene. Results represent the mean± SD from 4 experiments (A). The protein levels were examined by Western blotting (B). The histogram represents mean± SD of the densitometric scans of proteins bands from four experiments, normalized by comparison with β-Actin and expressed as a percentage of control (C). * P<0.01 vs control; # P<0.05 vs LDL.

