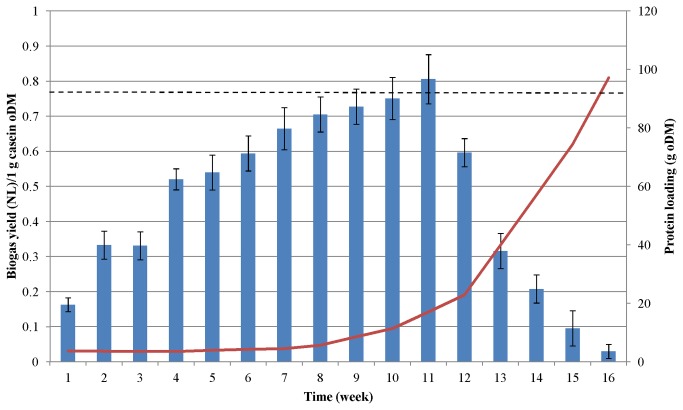
Figure 2. Biogas production from casein.
The fed-batch reactors were fed with increasing amounts of protein at weekly intervals. The protein dosages are shown by red line. The columns indicate the average specific biogas yields generated each week. Dashed line indicates biogas productivity according to the batch test.

