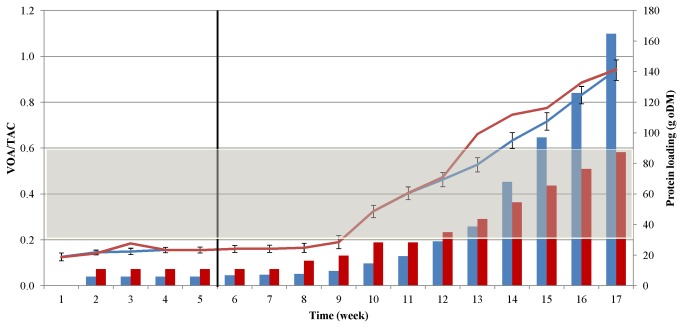
Figure 4. Changes in the VOAs/TAC values during the AD of casein (blue line) and blood (red line).
The protein loads administered at weekly intervals are indicated by the blue (casein) and red (blood) columns. The vertical black line denotes the end of the adaptation period, i.e. feeding with a constant, low protein dose. The gray area indicates the VOAs/TAC range under optimal operational conditions.

