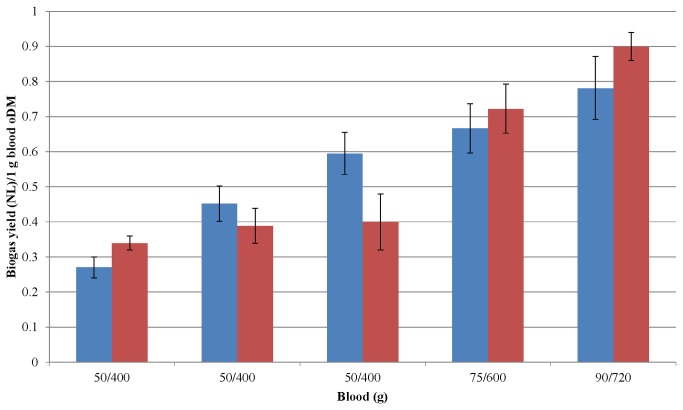
Figure 8. Scaling-up of AD of blood protein.
Weekly average specific biogas yields were determined in completely stirred tank reactors of 5 L (blue columns) or 50 L (red columns). The X-axis indicates the weekly substrate doses for the 5 L (first number) and 50 L (second number) reactors. Note that both reactors were fed with the same amount of substrate for 3 weeks and the weekly dose was raised afterwards.

