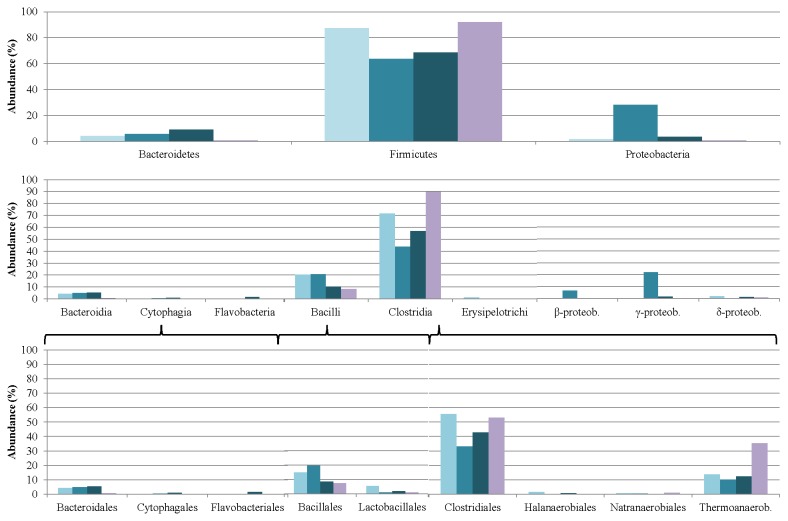
Figure 10. Changes induced in the Bacteria microbial community composition by adaptation to casein as sole carbon source.
The relative abundances of the taxonomic groups were determined in week 0 (light-blue columns), week 5 (medium-blue columns), week 9 (dark-blue columns) and week 12 (purple columns).

