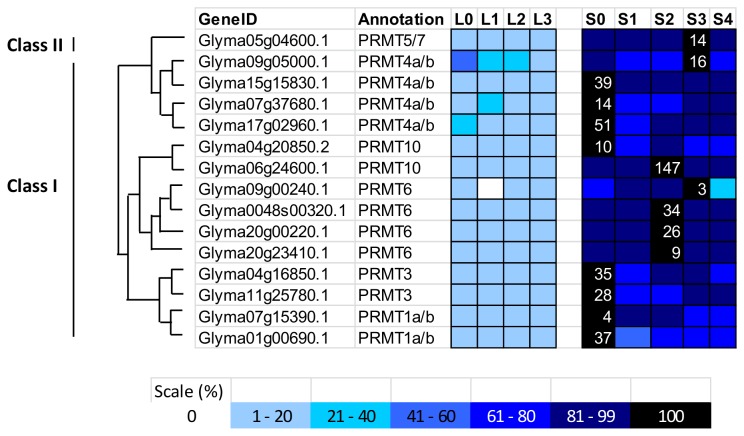
Figure 10. Expression profile and evolutional pattern of protein arginine methyltransferase (PRMTs).
The heat map shows the relative abundances of soybean genes identified. The highest expression level for each gene across different samples is given in RPKM value. The level of expression for a gene across different samples are represented as percentage of the maximum expression level in colour code from 0% (white) to 100% (black). Heat maps were plotted against the phylogenetic tree constructed using soybean protein sequences and GO annotation. L0, L1, L2, and L3 were leaves at 0 short-day, 1 short-day, 2 short-day, and 3 short-day; S0, S1, S2, S3, and S4 were shoot apical meristems at 0 short-day, 1 short-day, 2 short-day, 3 short-day and 4 short-day.

