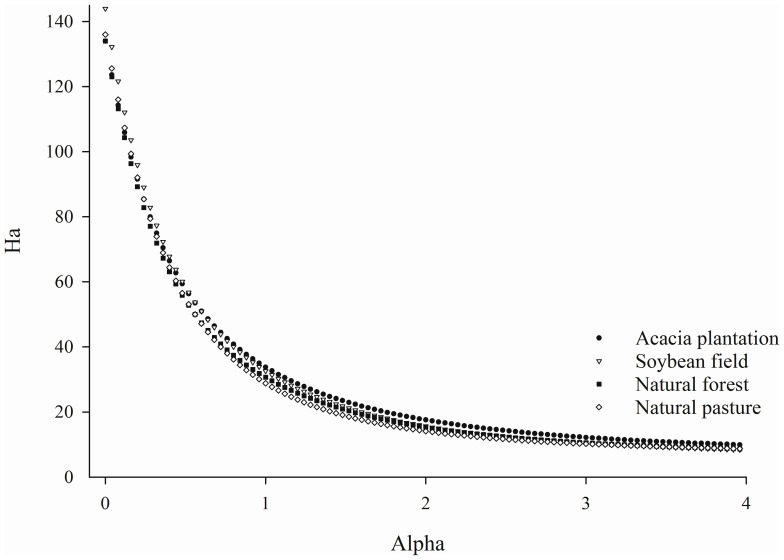
Figure 1. Rényi diversity profiles of soil bacterial communities from different land uses.
The x-axis shows the α value of the Rényi formula and y-axis shows Rényi diversity profiles values (Hα). α values at the scales of 0, 1, 2 are related to species richness, Shannon diversity index and Simpson diversity, respectively.

