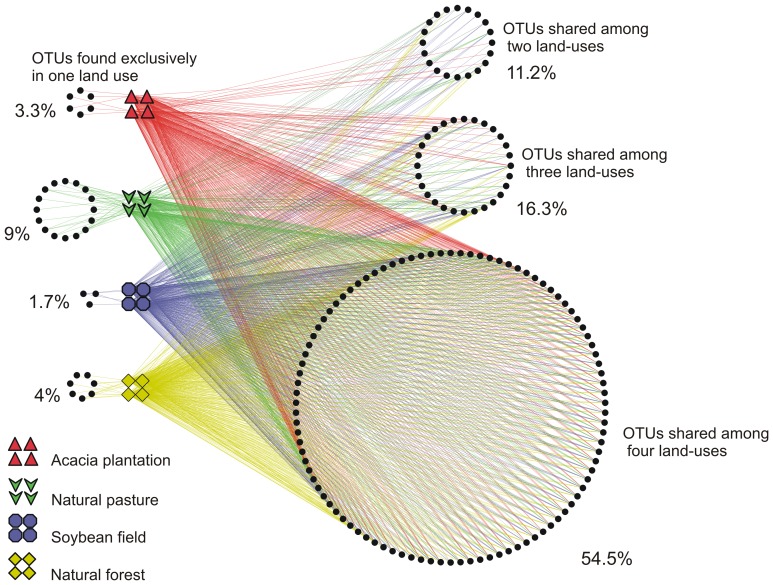
Figure 4. OTU network map showing OTU interactions at family level between all samples from different land-uses.
The circles represent the bacterial OTUs. When one OTU is found in only one node (land-uses or soil types) the two nodes are connected with a line (an “edge”) and when one OTU is found in more than one node (land-uses or soil types) the OTU is connected with more than one edge.

