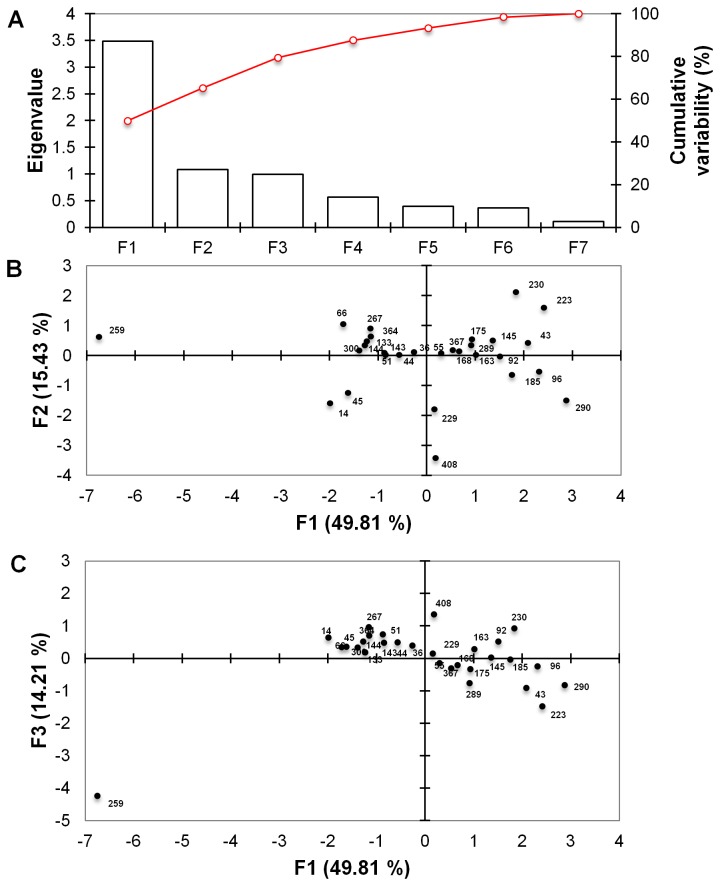
Figure 3. Principal component analysis (PCA) of tertiary screen.
Principal component analysis (PCA) was used to reduce the dimension of the tertiary dataset comprising of several interrelated variables (no alcohol, ethanol and butanol treatments on all 29 transformants) whilst retaining the variation present within the dataset. The dataset was transformed into variables (F1-F7) through component analysis using XLSTAT (Addinsoft) v2013.1 software. Scree plot of PCA analysis with the first three Eigenvalues (F1-F3) corresponding to the highest percentage of variance (A) Observation plot (built on Scree plot) in the factor space according to the first and second Principal components F1 and F2 (B) Observation plot (built on Scree plot) in the factor space according to the first and second Principal components F1 and F3 (C).

