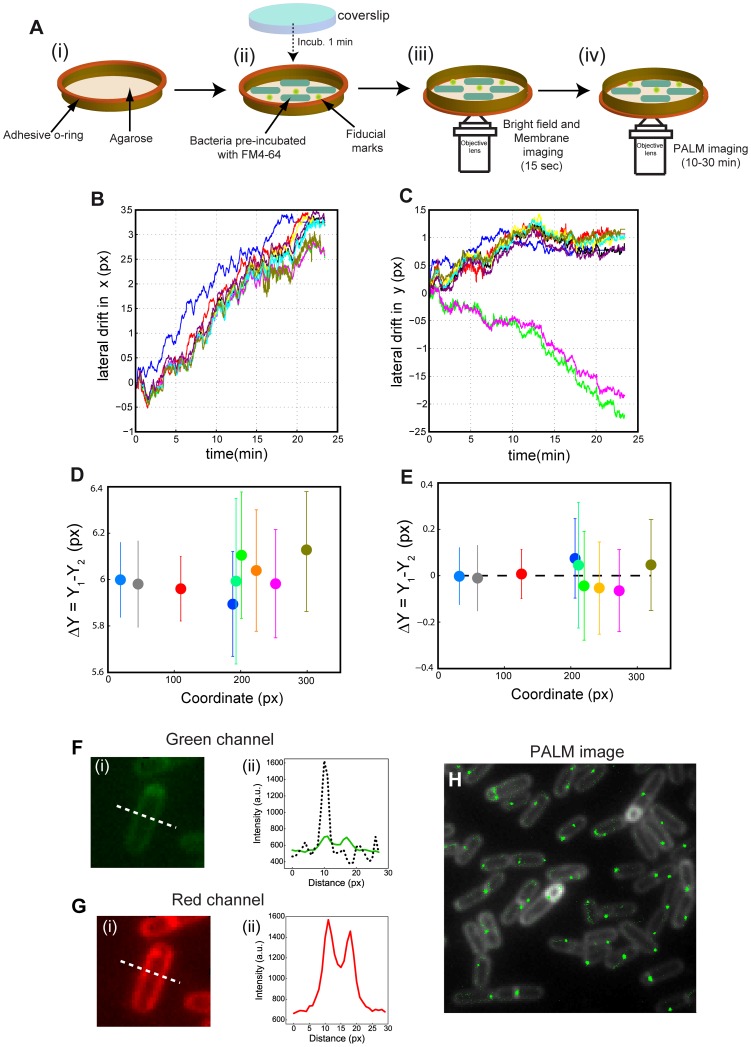
Figure 1. smSRM of bacteria in agarose pads.
A. smSRM imaging of bacteria in agarose pads. (i) A double-side adhesive o-ring was placed on a coverslip and melted agarose was added to create an adhering surface for the bacteria. (ii) Bacterial cells, previously stained with the membrane dye FM4-64 mixed with fiducial marks, were deposited on agarose and the pad was sealed with a clean coverslip. The sample was finally fixed on an Attofluor cell (Invitrogen) to avoid bacterial motion during microscopy. (iii–iv) Sequential imaging of bacterial membrane and SpoIIIE (iii) Epi-fluorescence image of the cell membrane was collected by exiting at 532 nm. (iv) smSRM images were collected by using continuous excitation with a 532 nm laser and by applying regular pulses of photo-activation with a 405 nm laser. B–C. Lateral drift during smSRM acquisition in agarose pads. Lateral drift over the full acquisition period was assessed by plotting the trajectories of fluorescent beads in x (B) and y (C) coordinates over time. Each colored trajectory corresponds to a single fluorescent bead. D–E. Alignment correction in smSRM experiments in agarose pads. Distortion arising from chromatic aberrations was quantified from the distance between the same fluorescent beads observed in two different emission channels (D) and corrected by using a linear transformation procedure (E) (see Materials and Methods). Each dot represents a different bead and the abcissa represents the x coordinate of each bead. Error bars represent the precision of localization before (D) and after (E) drift and alignment correction. F–G. Bleed-through of the membrane staining agent FM4-64 during smSRM imaging in agarose pads. (i) Image of a cell in the SpoIIIE-PA (SpoIIIE-eosFP) (F) and FM4-64 (G) channels. (ii) Line scans of the fluorescence signal across a B. subtilis cell (white dotted line in panels F-i and G-i) in the two observation channels (green and red lines, respectively). For comparison, the line scan of the fluorescence intensity emitted by a single SpoIIIE-PA protein was overlapped in F-ii (black dotted line). As expected, the signal-to-noise ratio and contrast in the red channel are adequate (SNR = 40/contrast = 2.3, panel G-ii). However, even at low dye concentrations the fluorescence signal from FM4-64 bleeds into the SpoIIIE-PA channel (SNR = 8/contrast = 1.3, panel F-ii), compromising single-molecule detection, lowering the localization precision, and often leading to false positive localizations. For comparison, in the single-molecule trace shown in F-ii the signal to noise ratio is 30, and the contrast is 3. H. SpoIIIE localization observed by smSRM in agarose pads. Pointillist representation of SpoIIIE-PA localization in B. subtilis at different cell stages. Each green dot represents a single fluorescent event detected in a single frame during the smSRM acquisition. False positive localizations can be observed scattered homogeneously over the cell membrane.

