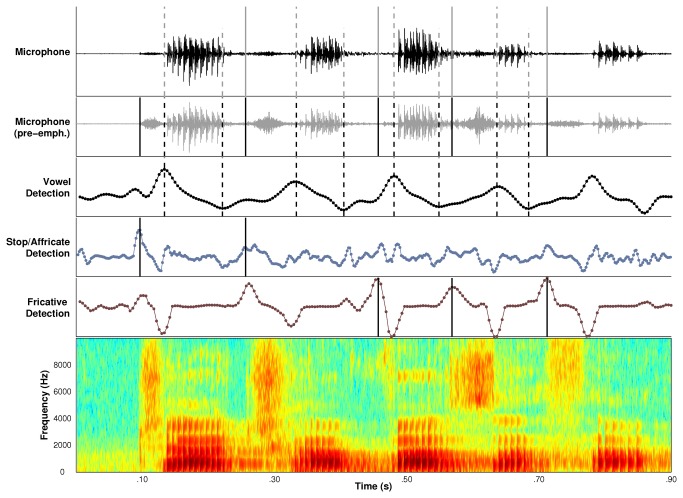
Figure 1. An example of the graphical user interface used to analyze speech sequence productions for each trial.
The microphone signal is displayed in the top panel and the pre-emphasized microphone signal in the second panel from the top. The next three panels display time-varying changes in the spectral features of vowels, stops and affricates, and fricatives. The time-varying signals in these panels were used to detect the onsets of the consonants in the sequence and the onsets and offsets of the vowels in the sequence. The bottom panel depicts a broadband spectrogram of the speech sequence produced by the speaker. Gray dashed lines indicate vowel onsets and vowel offsets in the ‘Vowel Detection’ panel. Consonant onsets are indicated by solid black lines in the ‘Detection’ panel describing their manner of articulation. The derived onsets and offsets are shown together in the pre-emphasized microphone panel. The microphone panel demonstrates how the onset and offset values were used to calculate the four vowel durations and no-consonant intervals in the sequence.

