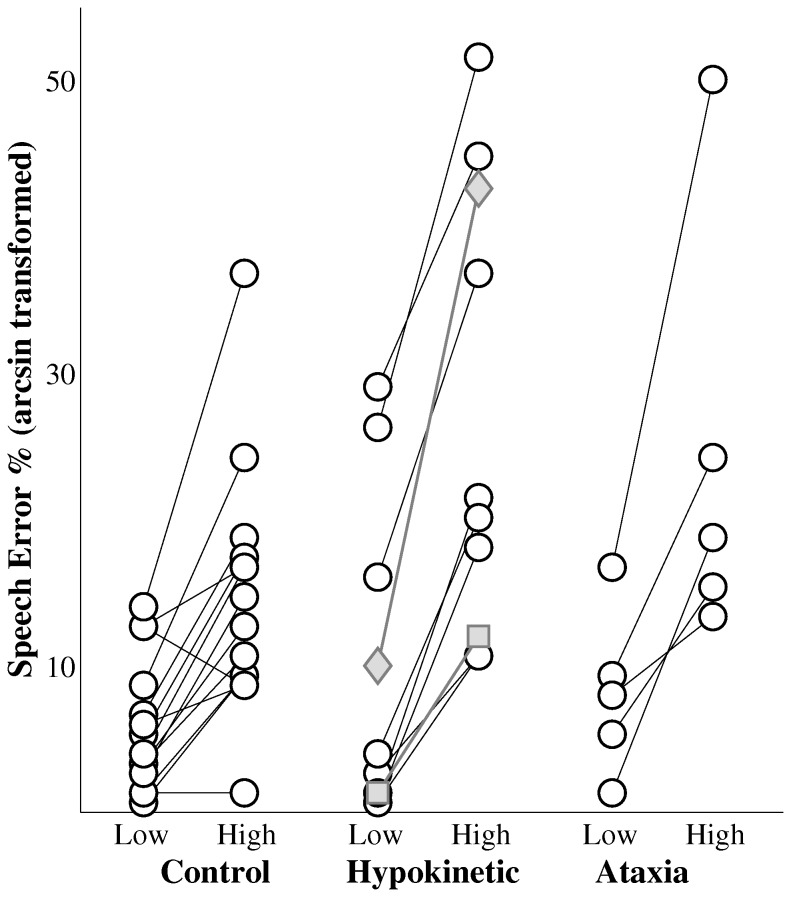
Figure 4. The effects of sequence complexity on speech error rates (arcsin transformed) by group.
Data from the speaker with multiple system atrophy (gray diamond) and the speaker with corticobasal degeneration (gray square) are plotted with the data from the speakers with hypokinetic dysarthria from Parkinson’s disease.

