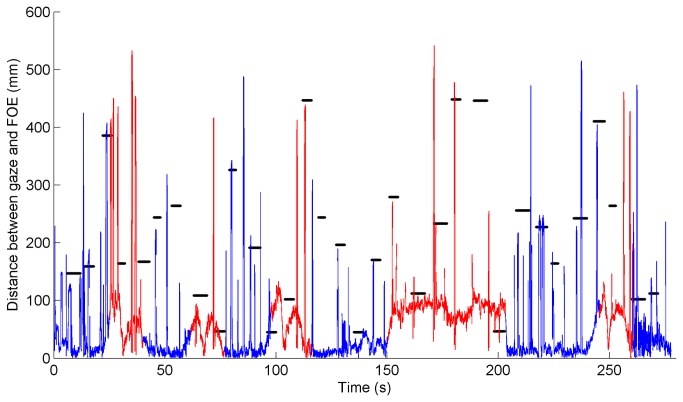
Figure 5. Distance between gaze and focus of expansion (FOE; static point on the screen) versus time, for one typical participant during session 2 (from the control group).
The line is red when driving on a curved road segment; the line is blue when driving on a straight road segment. Distances from the projected letters to the FOE are indicated by horizontal black lines. Distances from the FOE to the rear-view mirror, speedometer, and side mirrors are 450 mm, 300 mm, and 600 mm, respectively.

