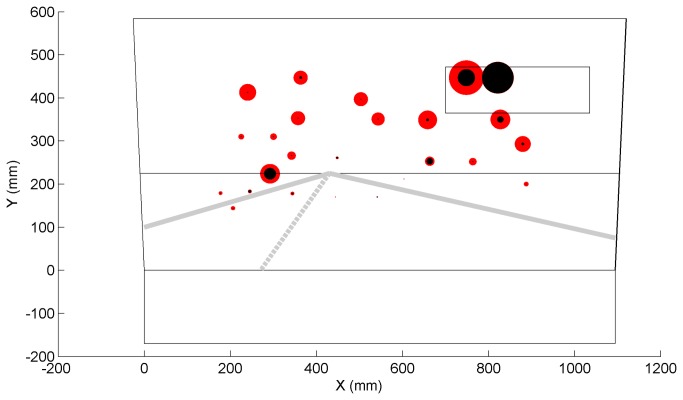
Figure 7. Mean number of letter misses for each projected letter position (red = patients, black = control participants); the radius of the circle linearly corresponds to the mean number of letter misses.
Patients’ mean number of missed letters ranged between 0% (on the road) and 78% (rear-view mirror).

