
Figure 2. Raw data on nosebleed frequency and duration.
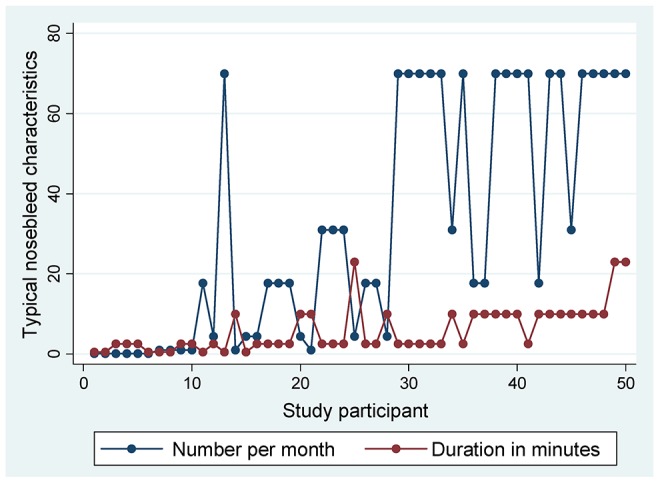
Typical number of nosebleeds per month (blue symbols/lines, data from ESS question 1), and typical duration of nosebleeds per month (red symbols/lines, data from ESS question 2) reported by the 50 study participants, ordered by increasing value of HAIR. Nosebleeds reported as “typically gushing or pouring” were significantly longer than nosebleeds reported as “typically not gushing or pouring” (mean [standard deviation] 8.9 [6.4], versus 4.5 [4.9] minutes, Mann Whitney p = 0.0038).