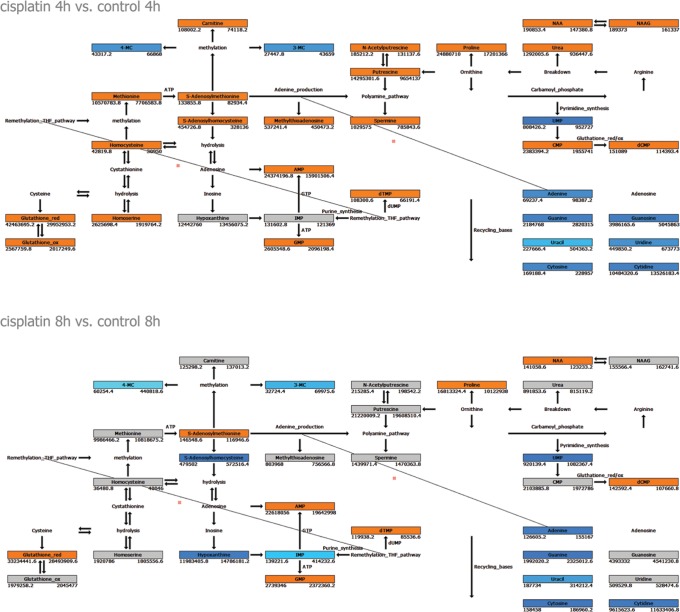
Figure 1. Network of differentially regulated metabolites.
Orange, Blue and Grey boxes indicate metabolites (mean of 5 replicates) upregulated, downregulated, and unchanged in cisplatin treatment, respectively (ANOVA p<0.01 and fold change 1.1); metabolites without a box were not detected. Numbers left (cisplatin) and right (control) under boxes indicate the corresponding intensities in MS-data. Results after 4 hours upper panel) and 8 hours (lower panel) are shown.

