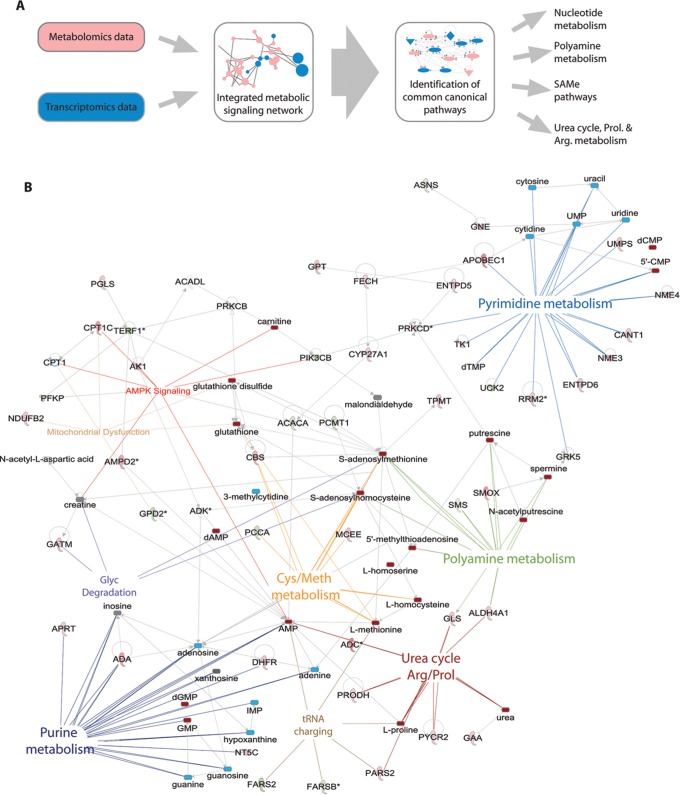
Figure 3. Integrated signaling network.
(A) Schematic representation of metabolomics and transcriptomics data integration leading to identification of common signaling networks related to nucleotide metabolism, SAMe pathways, polyamine pathways and urea cycle, and arginine & proline metabolism. (B) Integrated signaling network of metabolic enzymes and metabolites obtained with Ingenuity pathway analysis. Clusters of significantly enriched canonical pathways and related enzymes and metabolites are highlighted. Upregulated enzymes in green, downregulated enzymes in red. Upregulated metabolites in dark red, downregulated metabolites in blue.

