
Figure 2. Regulation of gp96 expression during differentiation of MOs to i.v.DCs and i.v.MACs.
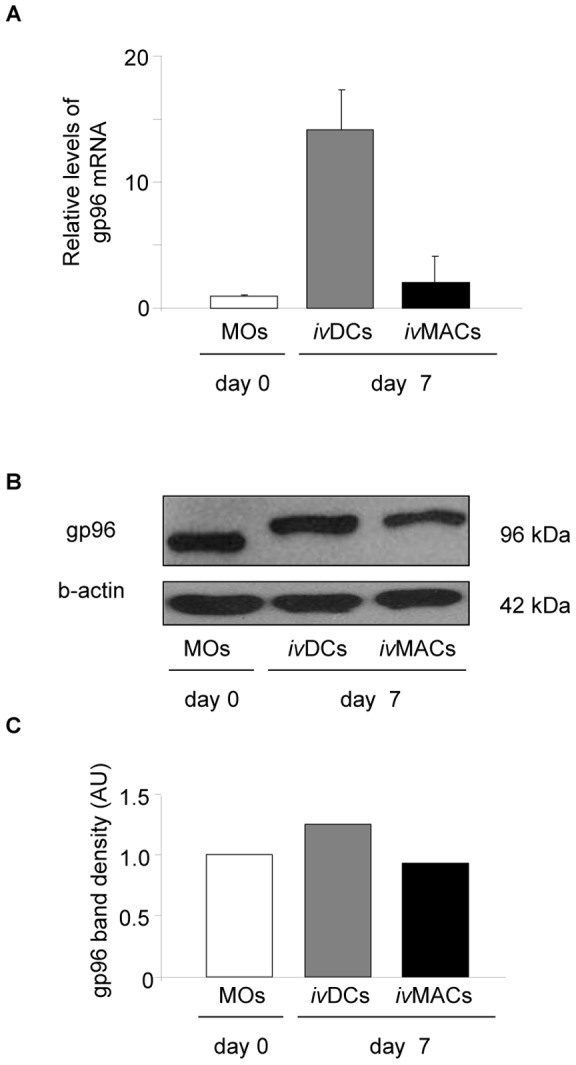
(A) Relative mRNA levels of gp96 (vs. GAPDH) by RT-PCR. Results are representative for three experiments in total. A typical result is shown where the basal level in MOs is set as a reference. Error bars represent the standard deviation of a single experiment measured in triplicate. (B) Western blot analysis of gp96. (C) Densitometric analysis. AU: arbitrary units, kDa: Kilodalton.