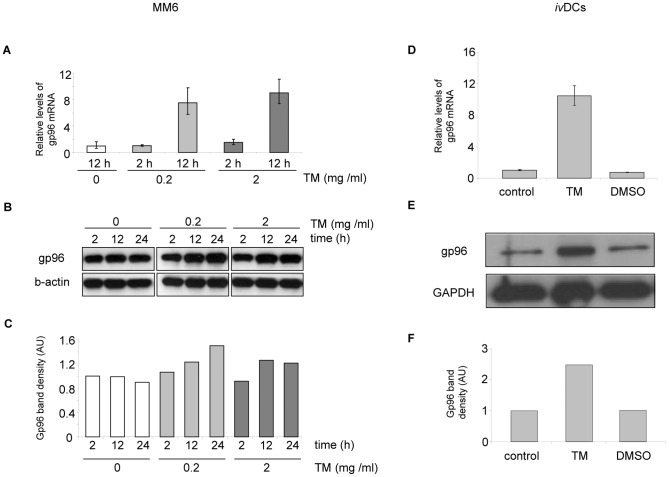
Figure 4. ER stress induction of gp96 in MM6 and i.v.DCs.
Panels A–C show the results for MM6 after 2, 12, and 24 hours of incubation with tunicamycin, panels D-F for i.v.DCs after 24 hours. Results are representative for three experiments. Three concentrations of tunicamycin were used to induce ER-stress in MM6 cells: 0, 0.2, and 2 µg/mL. (A, D) Relative mRNA levels of gp96 (vs. β-actin). Error bars represent the standard deviation of a single experiment measured in triplicate. (B, E) Western blot analysis of gp96. (C, F) Densitometric analysis. AU: arbitrary units.

