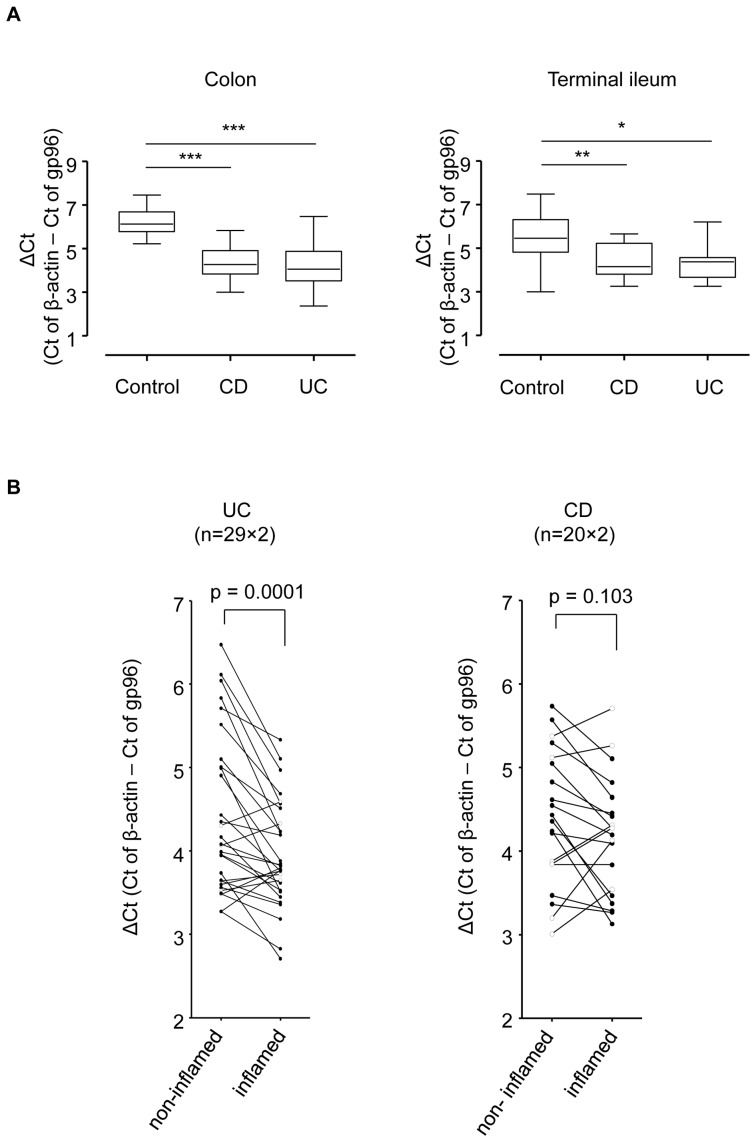
Figure 5. Analysis of gp96 mRNA in intestinal biopsies from IBD and control patients.
(A) Relative mRNA levels of gp96 (vs. β-actin) in biopsies from colon and terminal ileum of control and IBD patients. (B) Paired analysis of gp96 expression levels within individual patients (involved vs. non-involved). Error bars represent standard error of the mean. * p<0.05, ** p<0.001, *** p<0.0001.

