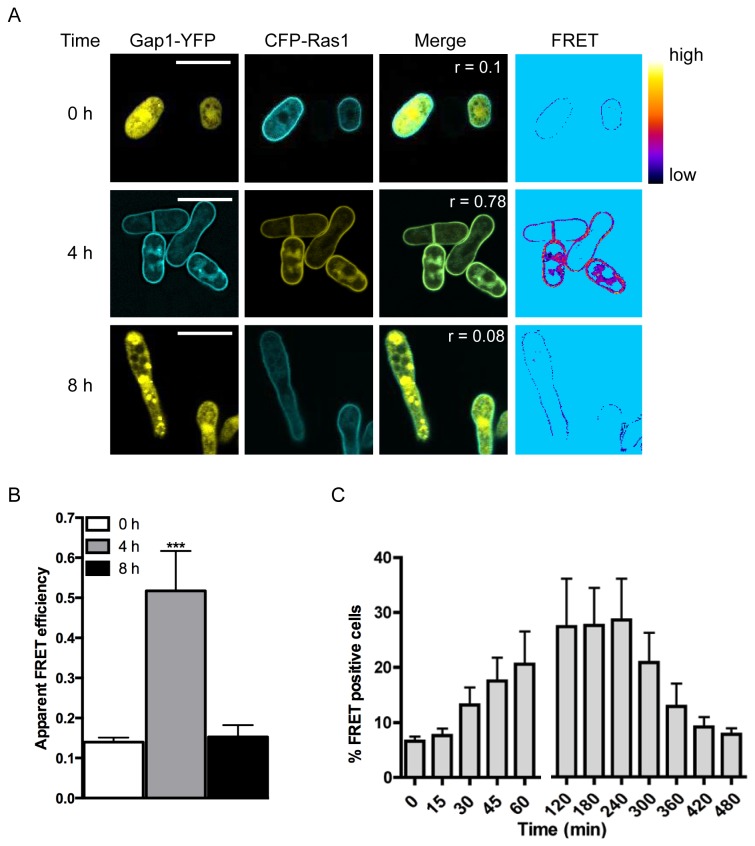
Figure 2. Gap1 interacts with Ras1-GTP following pheromone stimulation.
A, Δras1Δgap1 cells transformed with Gap1-YFP and CFP-Ras1 were treated with 10 μM pheromone and imaged to determine localization of the proteins and confirm an interaction using FRET. Pearson’s correlation coefficients (r) and regions of FRET were determined using the Image J FRET and colocalization plugin. Heat-map shows FRET efficiency low (black) to high (yellow). B, Quantified apparent FRET efficiency of cells as indicated, determined using FRET-SE (displayed as mean (±SEM) of 10 cells analyzed). FRET efficiency was significantly elevated after treatment with 10 μM pheromone. Statistical significance determined using a two-tailed Students’s t test; *** representing p < 0.001. C, FACS-based FRET analysis of cells described in A. Data shown are mean values (±SEM) of five independent experiments.

