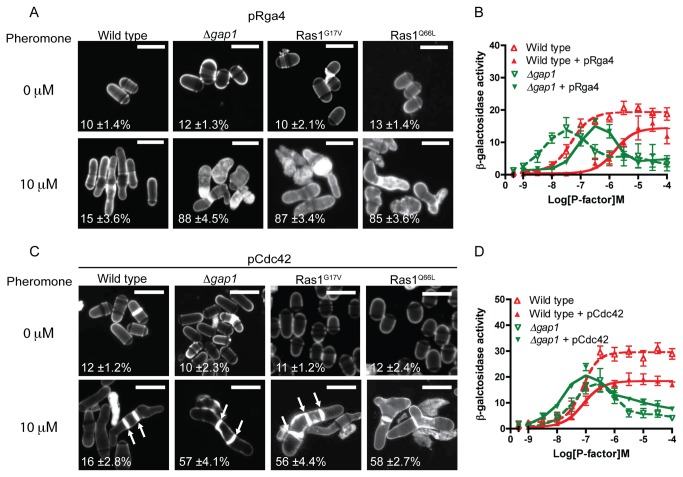
Figure 7. Pheromone-induced cell death is due to reduced Cdc42 signal transduction.
A, and C Values shown are percentage loss of cell viability. Scale bar 10 μm A, Calcofluor white staining of cells from indicated genotypes treated with pheromone. B, Pheromone-dependent transcription was quantified using the sxa2>lacZ reporter construct in strains expressing pRga4. C, Cells transformed with Cdc42 (pCdc42) were treated with pheromone, imaged as for A, many cells displayed multiple septa (arrows). D, Transcriptional response to pheromone was determined and revealed a slight restoration of maximal signal in the Δgap1 strain containing pCdc42. Values shown are mean of triplicate determinations (± SEM). Scale bar 10 μm.

