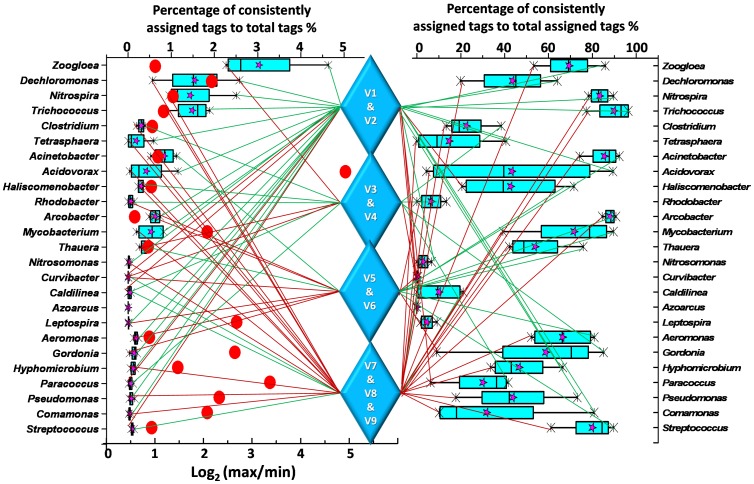
Figure 4. Comparison of consistently assigned tags by 3 methods among different sequencing regions for the moderately abundant genera.
In the left box chart, abundance is the percentage of consistently assigned tags for 4 regions (V1&V2, V3&V4, V5&V6 and V7&V8&V9, abundance of V1&V2 is the mean value of V12 and V21). Only 25 genera which were over 0.1% abundance as determined by at least one method were listed. Azoarcus had no consistently assigned tag although its abundance is high as determined by LCA annotation. Red dots showed the logarithmetics of the ratios of maximum identified tags to minimum ones among different regions. No dots for Nitrosonomas, Caldilinea, Curvibacter and Azoarcus because they get at least one 0-hit region. Percentages of 3-method consistently assigned tags to total assigned tags for each region were compared in the right box chart. Shown are the minimum, 25% quantile, median, 75% quantile and maximum. Stars indicated the average value. For each genus, colored lines link to the most abundant/consistently assigned region (green) and the least abundant/consistently assigned region (red). More links of green lines indicated the priority of the regions, such as V1&V2, while more red ones suggested the poor performance of the region (like V7&V8&V9) for these abundant genera.

