
Figure 1. Profile of microarray.
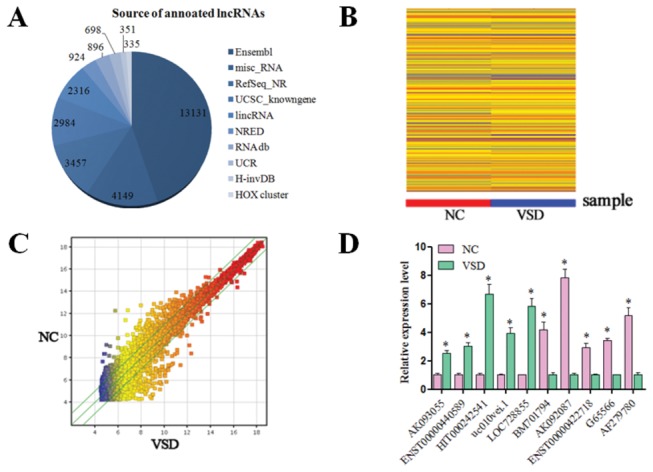
(A) Microarray v2.0 recovered the vast majority of expressed RefSeq transcripts; 29,241 lncRNAs and 30,215 coding transcripts can be detected using this this microarray. The lncRNAs are carefully collected from the most authoritative databases such as RefSeq, UCSC Knowngenes, Ensembl and related literature. (B) The scatterplot is a visualization of the variation (or reproducibility) between chips. (C) Hierarchical Clustering was performed to show the distinguishable lncRNAs and mRNA expression pattern among samples. (D) Our qRT-PCR data were confirmed to be consistent with the microarray results.