
Figure 2. APOBEC3G RNA levels in blood resting CD4+ T memory lymphocyte subtypes.
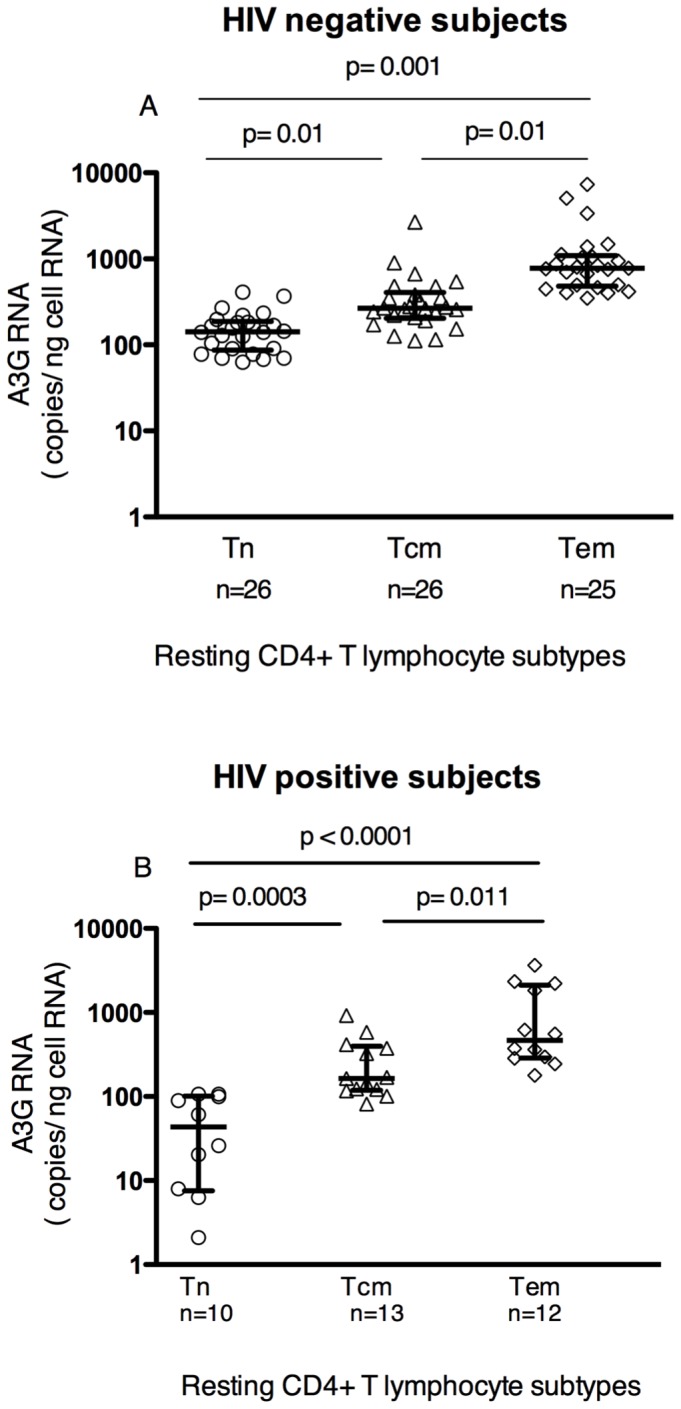
A3G RNA levels, determined by qRT-PCR with normalization to total cell RNA, progressively increased with differentiation state of resting CD4+ T memory lymphocytes, with naïve (Tn) < central memory (Tcm) < effector memory (Tem) lymphocytes. The same pattern was seen in these cells from HIV negative (A) and HIV positive (B) subjects. In (A) and (B), lines in plots represent median and inter-quartile range (IQR) values. P values were determined by 2-tailed Mann-Whitney U test.