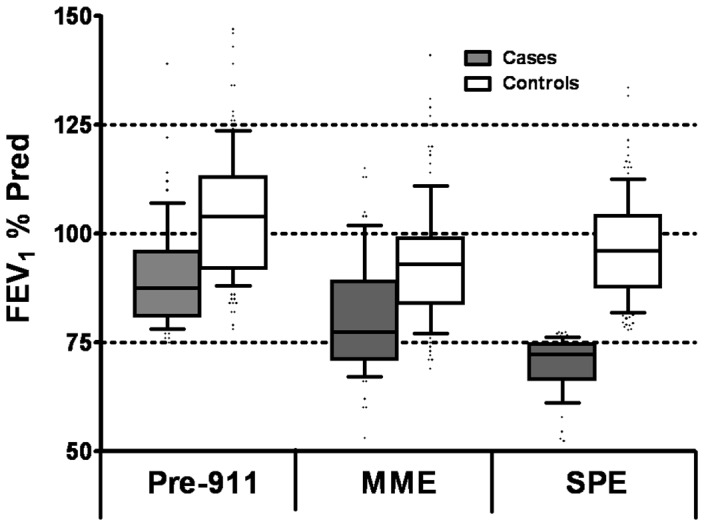
Figure 2. FEV1% Predicted based on NHANES of Serial PFTs of Cases and Controls.

Median and IQR are represented by box plots, with median drawn in the middle of the box. The extremes of the error bars (whiskers) represent 10–90% percentile.

Median and IQR are represented by box plots, with median drawn in the middle of the box. The extremes of the error bars (whiskers) represent 10–90% percentile.