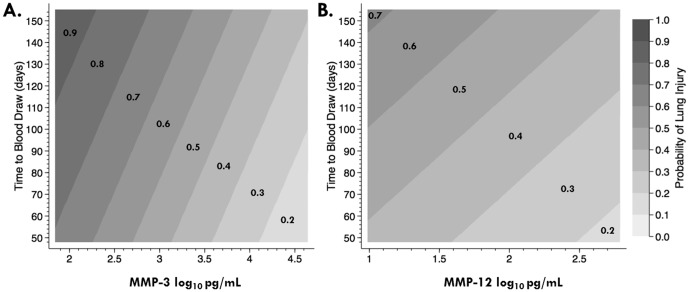
Figure 4. Probability of Developing WTC-LI.
Contour Plots express probability isopleths for the development of WTC-LI with all other covariates held constant. When either MMP-3 (A) or MMP-12 (B) increases, the probability of lung injury decreases. As time to blood draw increases, the probability of lung Injury increases.

