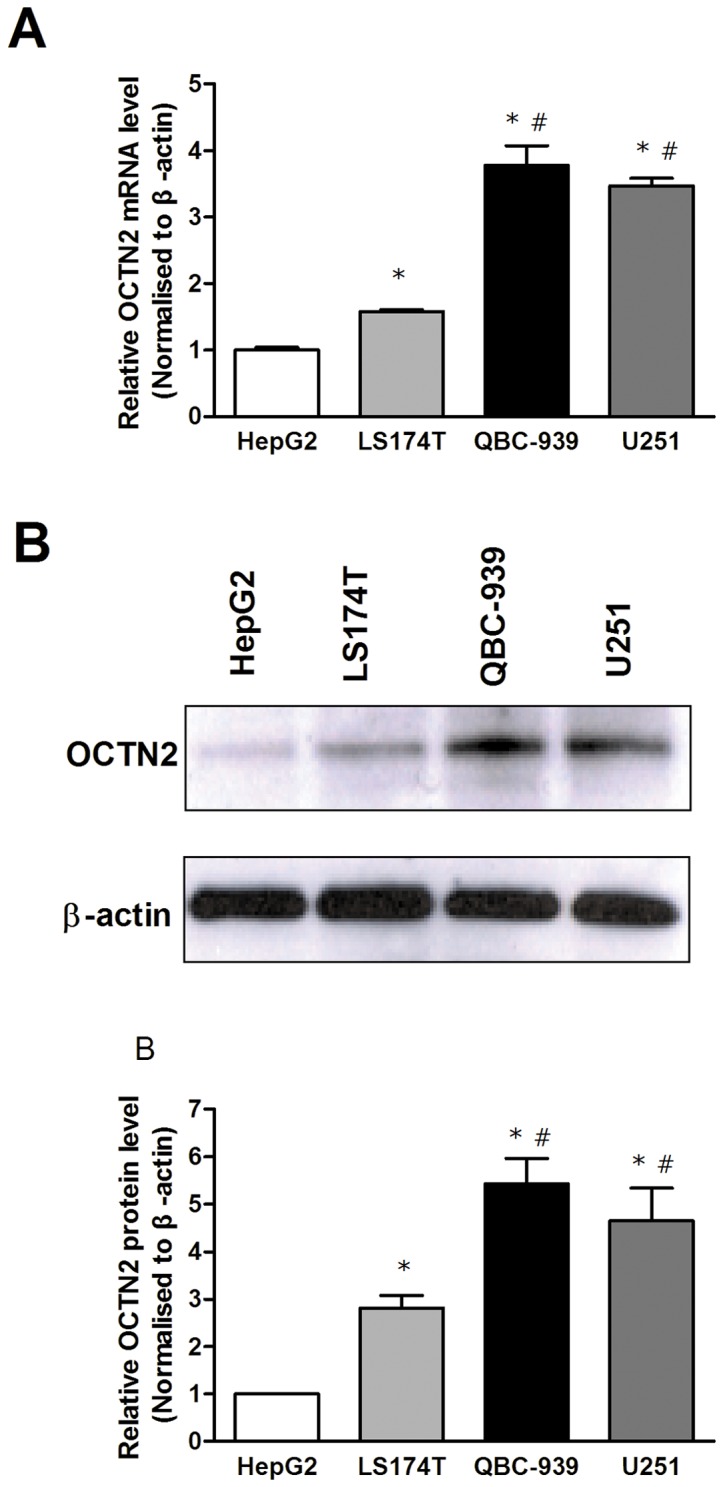
Figure 1. Expression of OCTN2 in cancer cell lines.

(A), analysis of mRNA levels of OCTN2 in cancer cell lines. Total RNA in cancer cells was purified by TRIzol reagent for cDNA synthesis and the mRNA levels of OCTN2 were analyzed by Quantitative RT-PCR. (B), analysis of protein levels of OCTN2 in cancer cells. Total proteins were extracted and protein levels of OCTN2 were analyzed by western blotting. The relative expression of mRNA and protein was normalized to β-actin. The expression of HepG2 was set as 1. All of mRNA and protein analysis were performed three times. Significant difference from HepG2 or LS174T cell is denoted with asterisk (*, p<0.05) or number sign (#, p<0.05), respectively.
