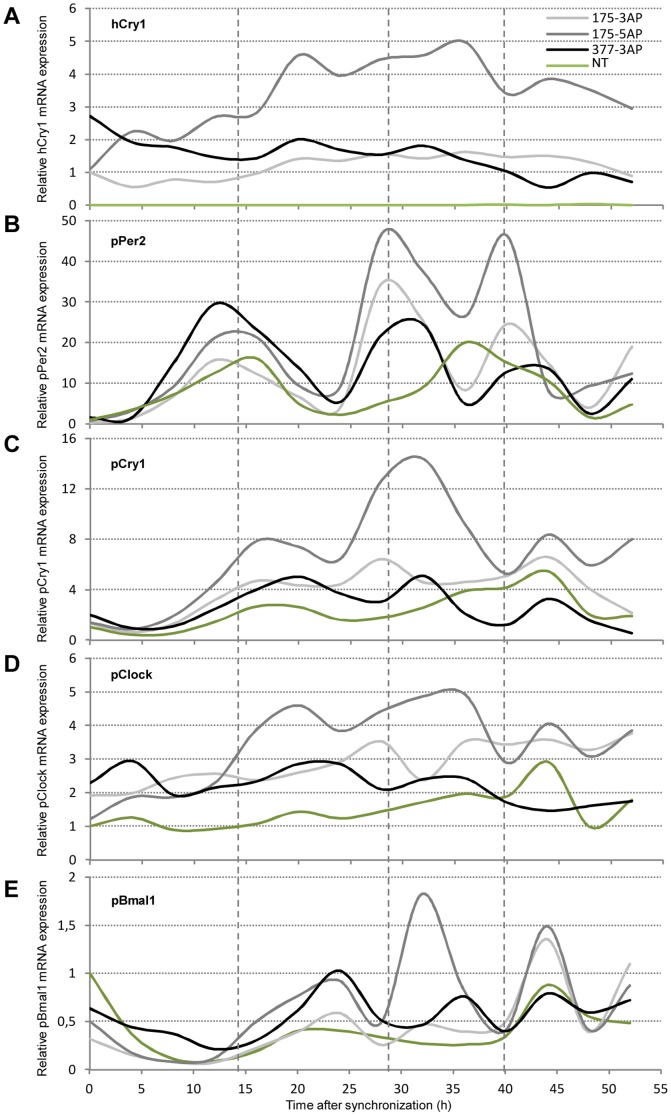
Figure 4. Altered oscillation patterns of key clock transcripts in fibroblasts from transgenic minipigs.
Fibroblasts were expanded from skin-biopsies obtained from three transgenic minipigs (#175-3AP, #175-5AP, and #377-3AP) and one NT control (#321-1wt). The cells were serum-shocked after which total RNA was extracted every fourth hour through 52 hours. Quantitative RT-PCR was performed with exon-exon spanning primers targeting (A) hCry1 (B) pPer2 (C) pCry1 (D) pClock and (E) pBmal1 normalized to endogenous ACTB. Expression is relative to minipig #175-3AP in (A) and to the NT control in (B–E) and is depicted as a function of time. The experiment is performed in triplicate and data are presented as mean values with smoothened curves. Grey dashed lines indicate the first, second and third zenith of pPer2 mRNA expression in cells from minipig #175-5AP.

