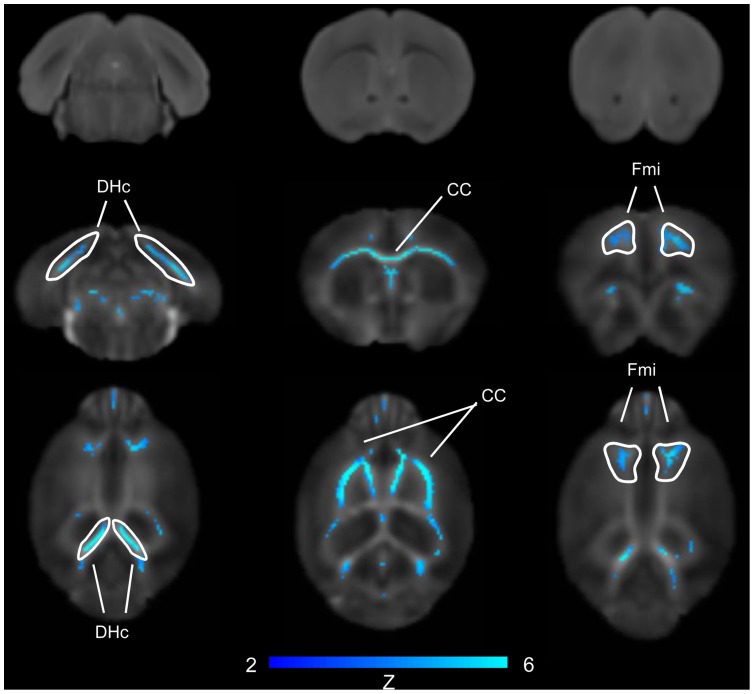
Figure 1. Major FA reduction in hippocampal commissure and corpus callosum of BTBR white matter.
Voxelwise significant FA differences between BTBR (N = 9) versus B6 (N = 9, Z = 1.96, pc = .01). Representative T2-weighted anatomical images from a BTBR subject (top row) are shown for comparison. [CC: corpus callosum; DHc: dorsal hippocampal commissure; Fmi: Forceps minor of the corpus callosum].

