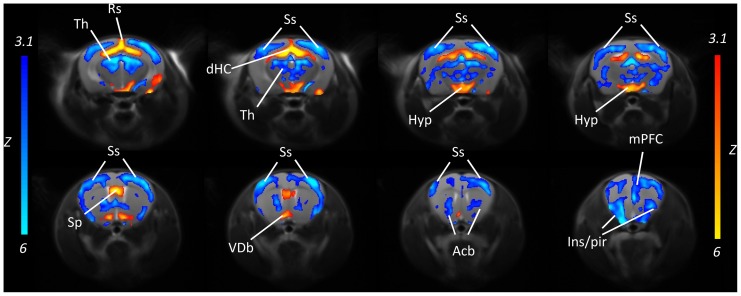
Figure 7. Reduced basal functional activity in the cortex of BTBR mice.
Coronal view of the brain regions exhibiting increased (yellow-red) or reduced (blue) bCBV in BTBR (N = 10) versus B6 control subjects (N = 10, Z>3.1, pc = .01) [Acb: nucleus accumbens; Hyp: hypothalamus; Ins/Pir: insular/piriform cortex; mPFC: medial prefrontal cortex; Sp: septum; Ss: somatosensory cortex; Th; thalamus; Rs: retrosplenial cortex; VDb: ventral diagonal band].

