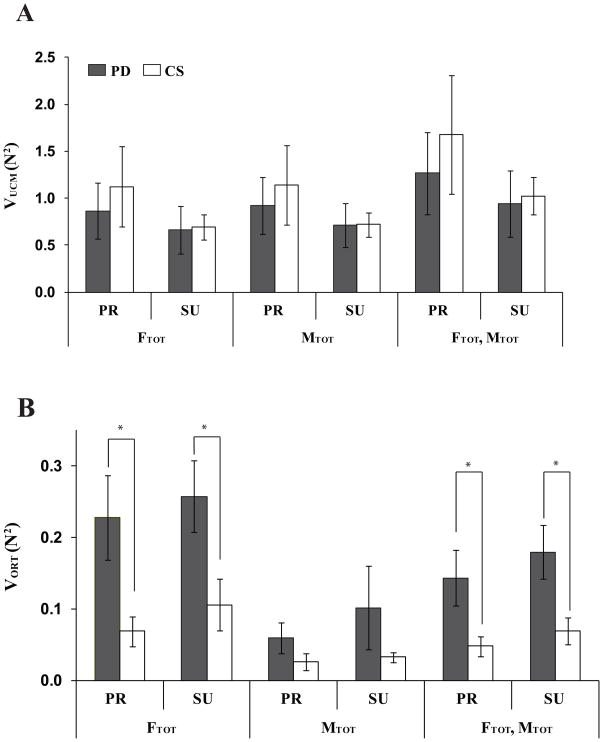
Figure 4.
Two components of variance, A: VUCM and B: VORT in the finger force space computed with respect to FTOT, MTOT, and {FTOT; MTOT} stabilizations for the PD (gray bars) and CS (white bars) groups. Variances were quantified per degree-of-freedom of the corresponding subspaces. The average values across subjects are presented with standard error bars. PR and SU stand for pronation and supination, respectively. The asterisks show statistically significant differences between the PD and CS groups at p < 0.05.

