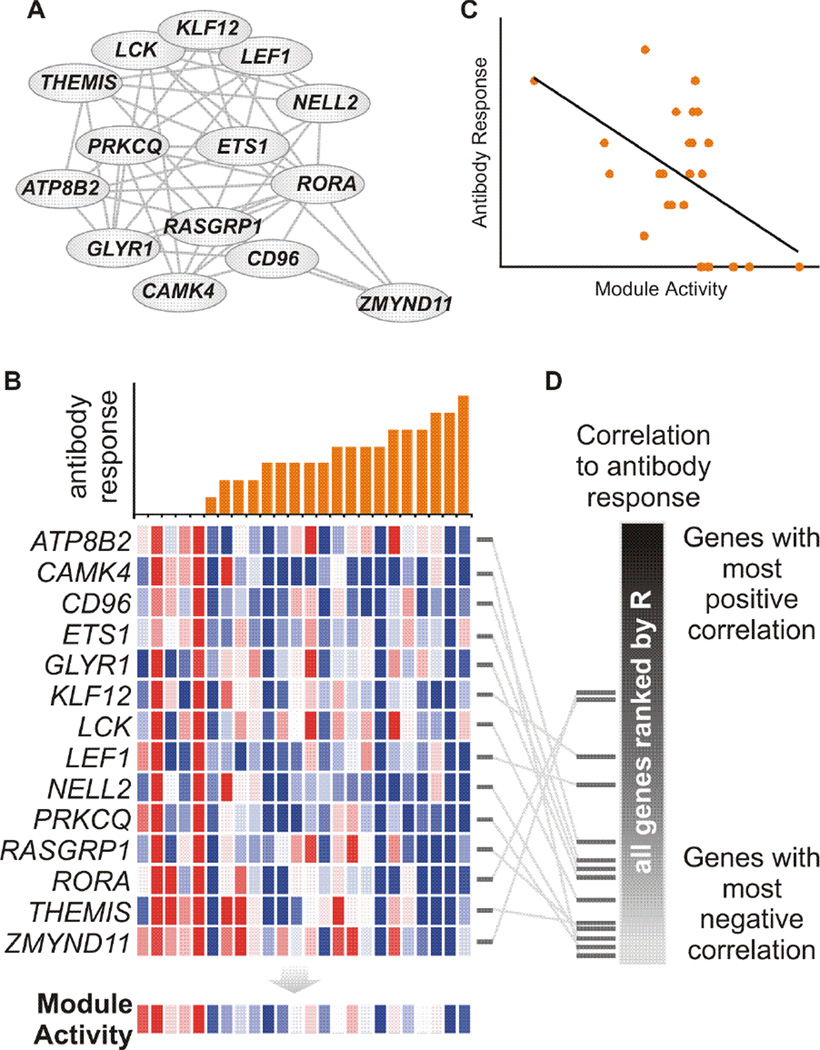
Figure 2. Antibody correlation analysis of a gene module/pathway.
(A) Gene module that was learned from previous data (Li et al., in preparation). Genes are connected by significant coexpression in previous studies. This module links the CAMK4 activity to T cell activation, a possible mechanism for the observed Camk4−/− phenotype in Nakaya et al [12]. (B) Example computed from flu TIV data [12]. Each column represents a subject. Top: antibody response after a month (max fold change of hemagglutination-inhibition antibody titers or HAI) and bottom: gene expression change after three days (log2 scale). Module activity is taken as the mean value of member genes (last row of bottom). (C) Pearson correlation between module activity and antibody response. (D) The significance of antibody correlation can also be tested via positional statistics, e.g. the implementation in GSEA. All genes are ranked by their Pearson correlation to antibody, and the positions of module member genes are shown as horizontal bars.

