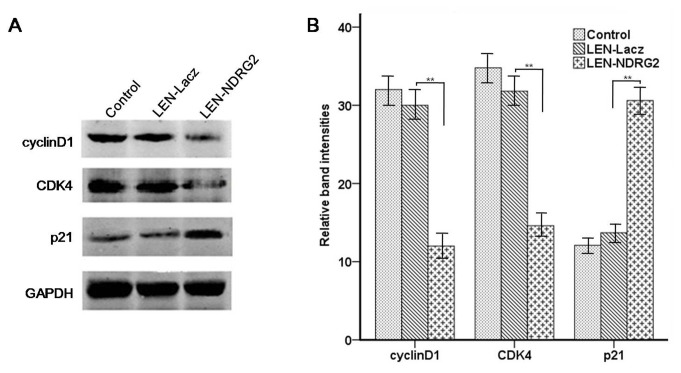
Figure 6. The influences of NDRG2 overexpression on T24 cells infected with lentivirus.
(A) The effect of NDRG2 overexpression on G1 cell cycle and apoptosis regulators as assayed by western blot. (B) Relative quantification of protein expression, normalized to GAPDH levels. The figure shows the tendency of each group as indicated. All the assays were repeated independently for at least three times. The results are shown as the mean ± SD (** p<0.01)..

