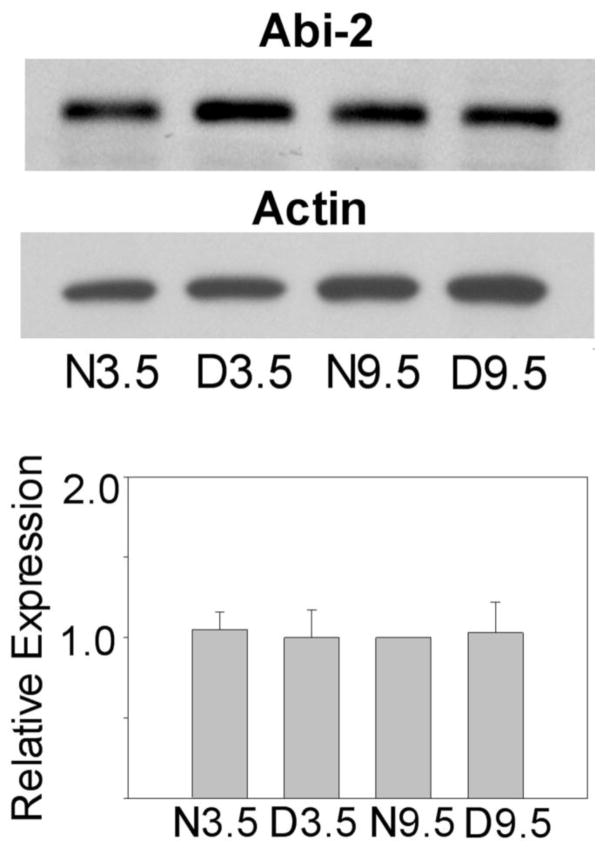
Figure 5.
Top. Western blots showing levels of Abi-2 and actin protein expression in mouse N3.5, D3.5, N9.5 and D9.5 frontal cortex. Bottom. Mean levels of Abi-2 expression (corrected against actin) as determined by densitometry from three independent groups of mice. Means +/− S.E. are plotted. Data from each group were normalized against N9.5 animals.

