
FIGURE 5.
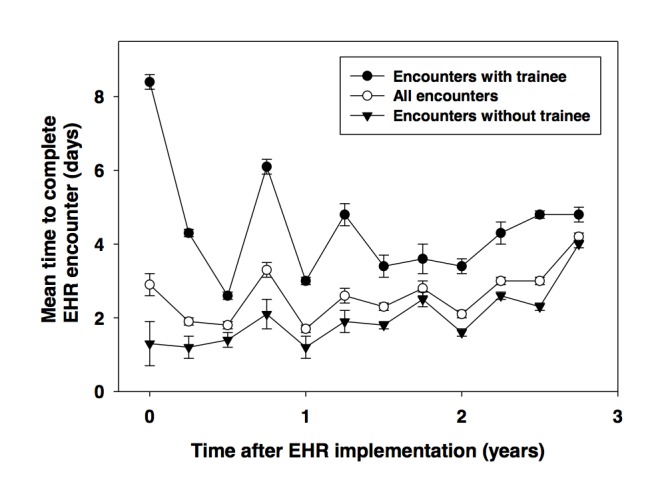
Trends in mean time required for electronic health record (EHR) chart completion by 23 stable faculty providers within an academic ophthalmology department during 3 years after system implementation. Data are displayed for all encounters considered together, for encounters in which resident or fellow trainees were involved with clinical documentation, and for encounters in which trainees were not involved. Error bars represent standard error of the mean. Among all 23 providers, time series regression analysis showed that median time increased by 9.6 minutes per month over this time period.