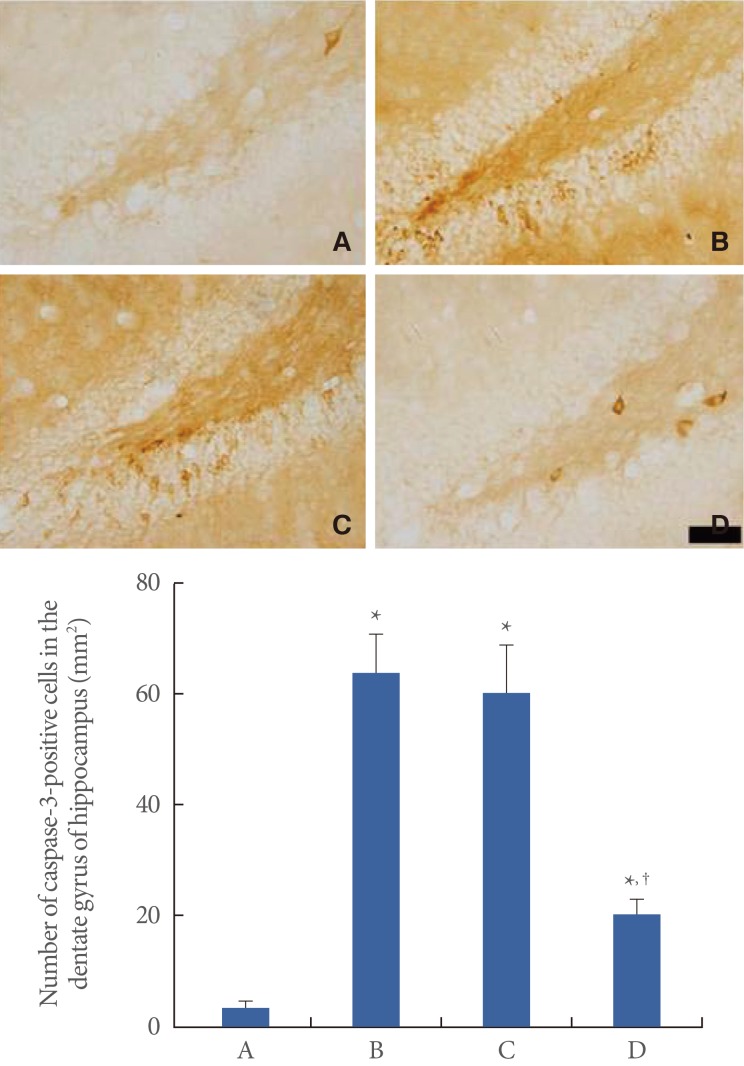
Fig. 3.
The effects of various stress types on caspase-3 expression in the hippocampal dentate gyrus. Upper: Photomicrographs of the caspase-3-positive cells in the hippocampal dentate gyrus. The scale bar represents 50 µm. Lower: Number of caspase-3-positive cells in the hippocampal dentate gyrus. The data are presented as the mean±standard error of the mean. (A) Normal group, (B) restraint stress group, (C) noise stress group, (D) cold stress group. *P<0.05 compared to the normal group. †P<0.05 compared to the restraint stress group.

