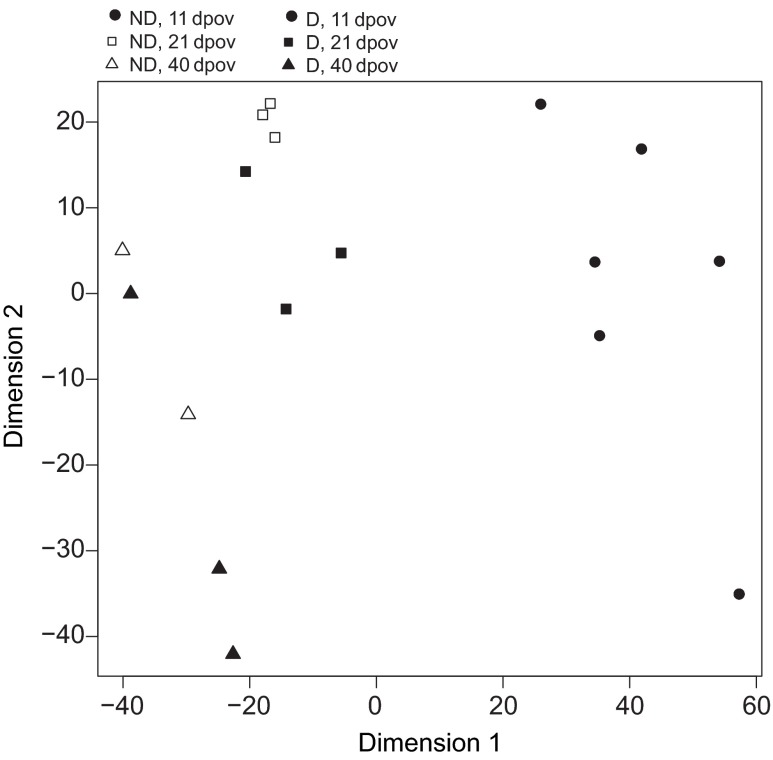
Fig. 3.
Multi-dimensional scaling plot representing distances between expression profiles of each library across photoperiod treatments and development times (see Materials and methods for details). D and ND represent diapause-inducing photoperiods and non-diapause-inducing photoperiods, respectively; 11, 21 and 40 dpov refer to pharate larval collection at 11, 21 or 40 days post-oviposition.

