
Figure 1.
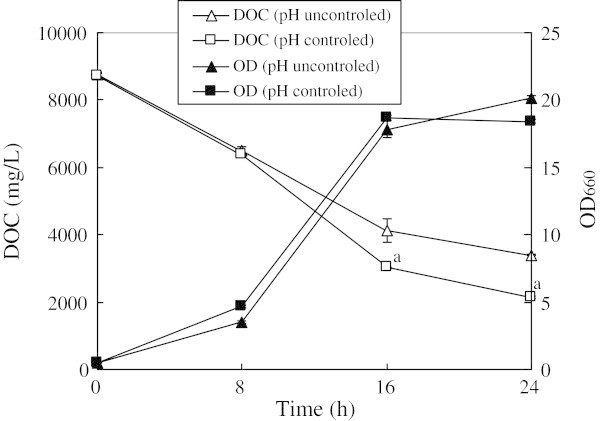
Effect of pH control on cell growth and DOC removal treating 5-times diluted barley shochu wastewater. The time course of the DOC concentration of pH uncontrolled (open triangle) and pH controlled (open square), and the cell growth (OD660) of pH uncontrolled (closed triangle) and pH controlled (closed square). The results were shown as average of three different experiments. The error bars shows standard divisions a Significantly different from pH uncontrolled (p < 0.05) by t-test.