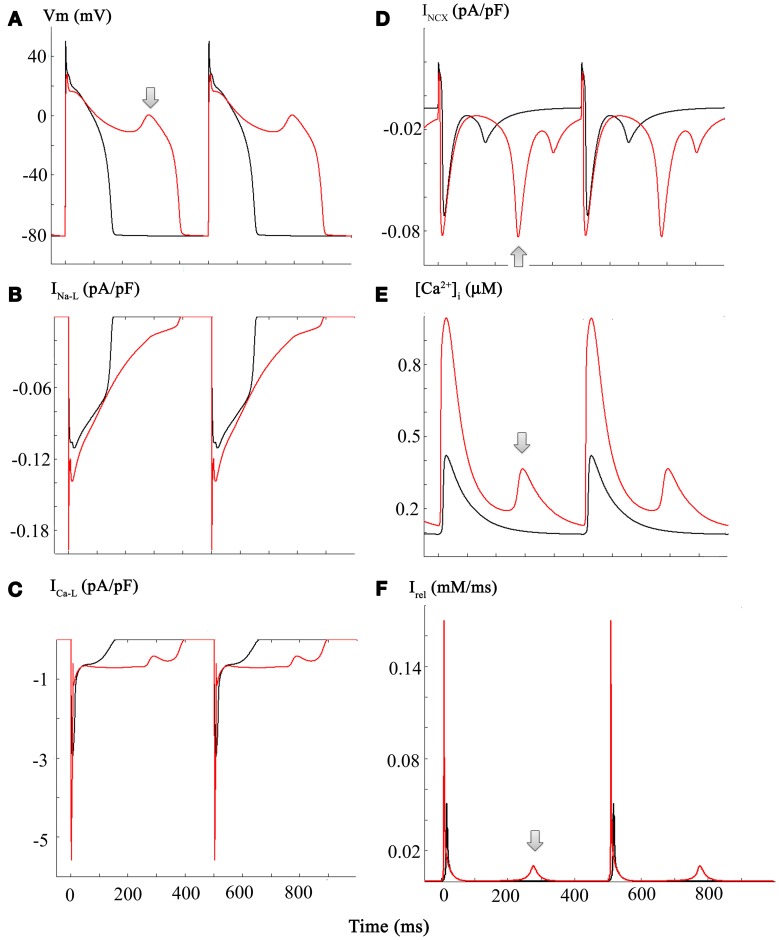
Figure 5.
Diagram illustrating a plausible mechanism for generation of EADs in our modified Grandi model of the human ventricular action potential. Panels (A through C) each consist of a pair of superimposed records for the AP, INa-L, and ICa-L records, respectively. Those in black correspond to control or baseline conditions, and the CO-induced changes are shown in red. Important new information is illustrated in the corresponding (i) INCX currents, Panel (D); (ii) [Ca2+]I data, Panel (E); and the current generated by Ca2+ release from the sarcoplasmic reticulum Irel, Panel (F). The arrows denote the EAD (Panel A) and underlying spontaneous Ca2+ release from the SR (Panel F), and INCX current driven by the increase in [Ca2+]i (Panel E). Refer to Results and Discussion sections for further details and explanation.

