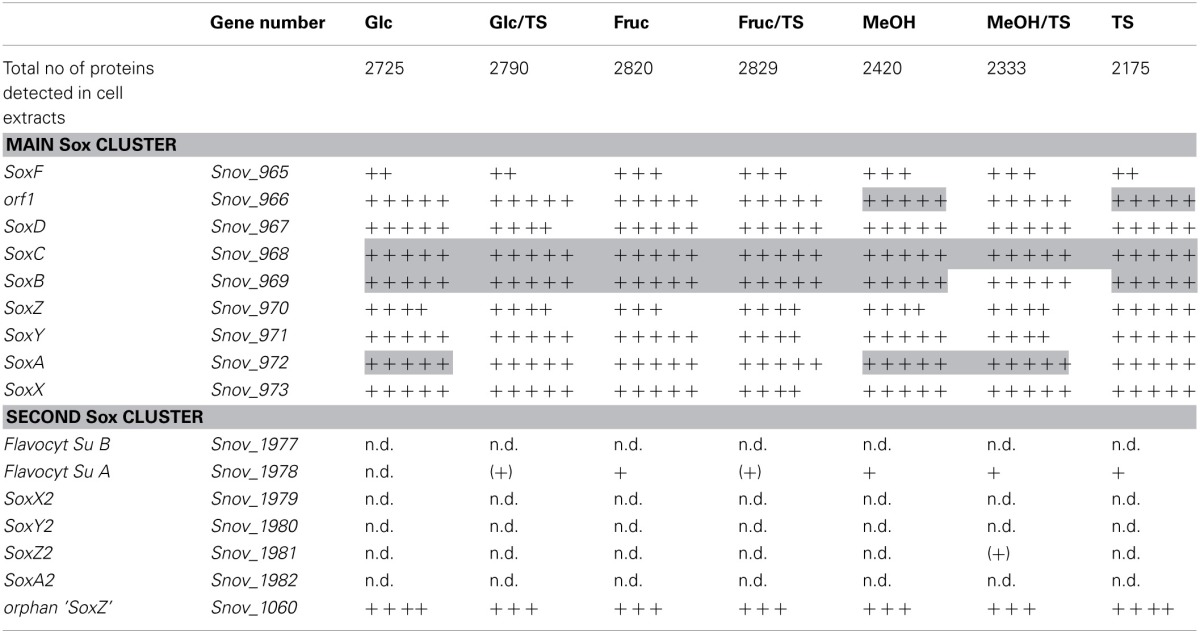
Table 2.
Presence of proteins involved in sulfur chemolithotrophy in S. novella cell extracts from chemolithoautotrophic, methylotrophic, heterotrophic, and mixotrophic growth conditions.

+, indicate expression levels, with the number of crosses indicating the band in which the protein was detected; +++++, top 10% of proteins; ++++, 10–30%; +++, 30–50%; ++, 50–70%; +, 70–90%; (+), 90–100%; n.d., not detected. Shading indicates that the protein was in the top 2% of proteins that were detected in the sample.
