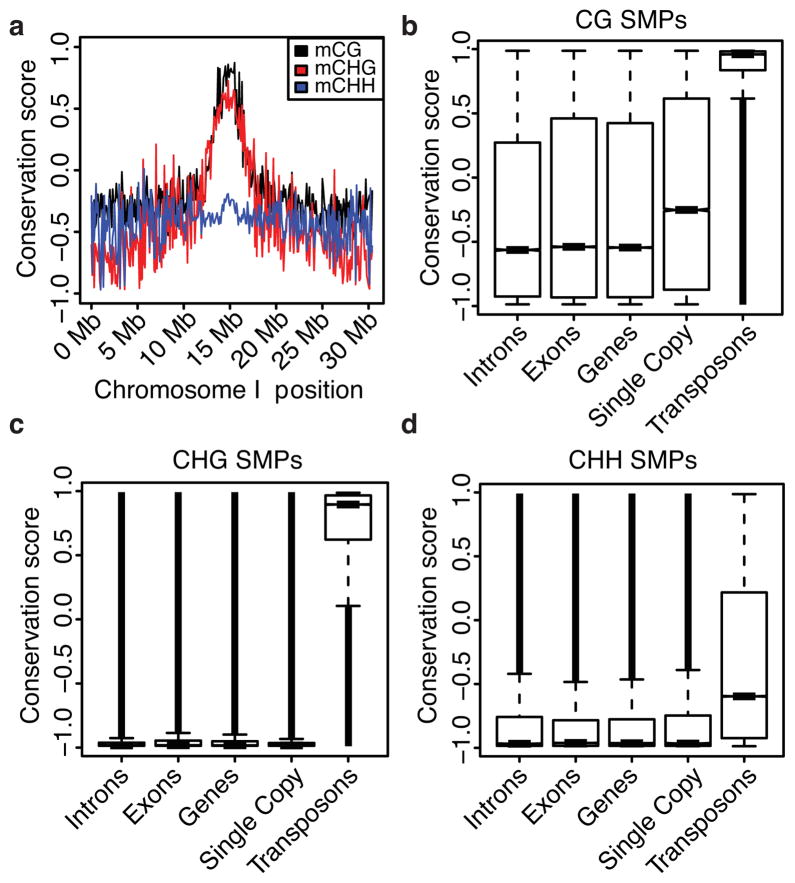
Fig. 1. Population-wide analyses of SMPs.
(a) A plot of the genome-wide distribution of methylation conservation across chromosome I. (b–d) The distributions of SMP conservation scores across various genomic features. Notches in the boxplots represent bootstrap estimated 95% confidence intervals around the medians.

