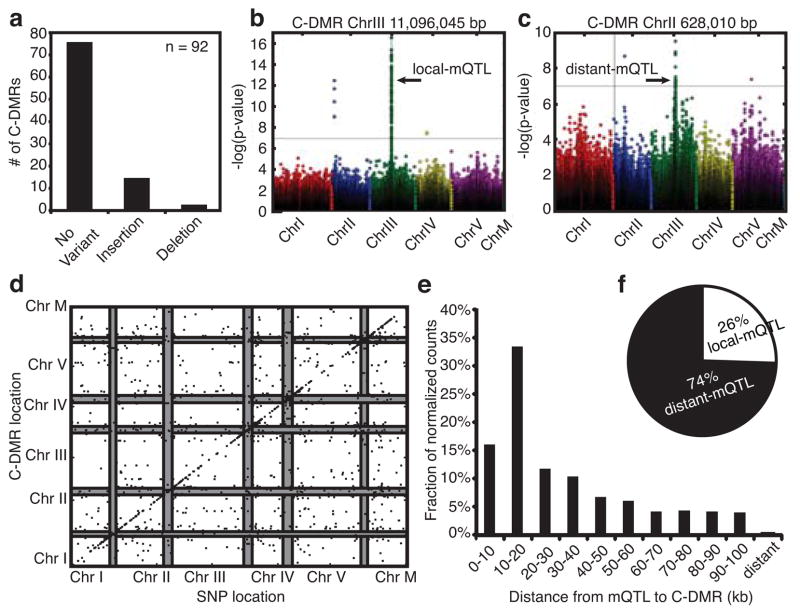
Fig. 4. Association of natural genetic variants and methylation variants.
(a) A summary of the type and number of variants (non-SNPs and small indels) discovered at 92 C-DMRs. Manhattan plots with examples of (b) local and (c) distant mQTL. (d) Distribution of significant mQTL and the C-DMRs with which they associate. Each point represents a significant association between a C-DMR and a block of SNPs. The x-axis denotes the genomic location of the SNP block, and the y-axis indicates the position of the C-DMR. The pericentromeres on each chromosome are shown as grey bars. (e) The distribution of distances of mQTL from their C-DMRs normalized for the base space covered by each range of distances. (f) The ratio of distant mQTL to local mQTL.

