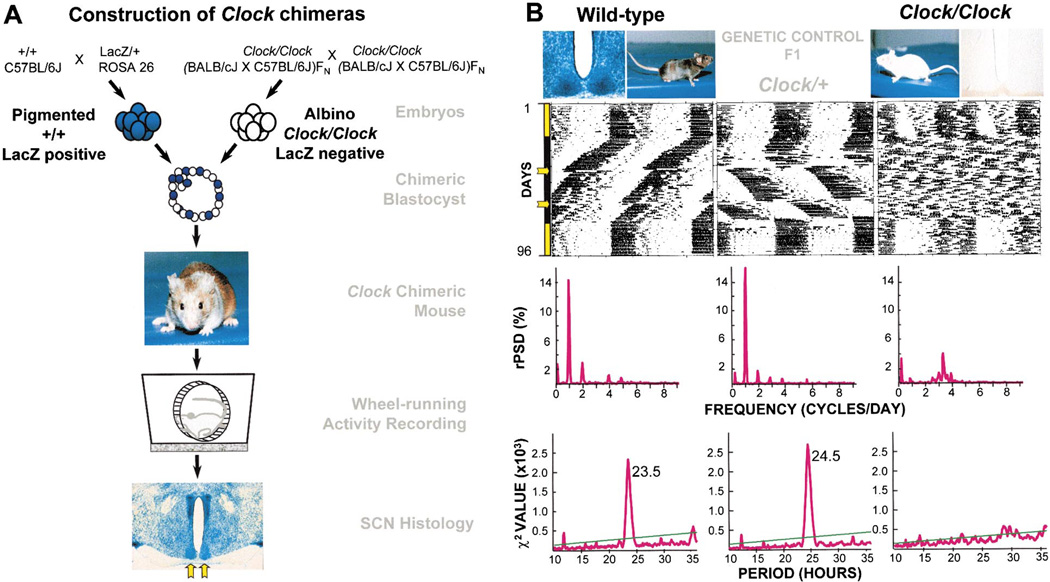
Figure 1. Clock Chimera Genotypic Components.
(A) Construction of Clock chimeras. Crosses are performed to produce two classes of embryo that differ in coat color, Clock genotype, and presence or absence of a LacZ cell marker. Embryos of contrasting genotype are fused to form a chimeric blastocyst that develops into a chimeric mouse, identifiable by its variegated coat color. Testing of circadian behavior is followed by SCN histological analysis. The bilaterally paired SCN is indicated by yellow arrows.
(B) Component strain controls. The three genetic differences between component embryos are illustrated. Examples of pigmented and albino coat colors are shown. Examples of control SCN are also shown, in which all of the cells are either LacZ positive (blue) or LacZ negative. Activity records show examples of circadian behavioral phenotypes for both component genotypes (WT and Clock/Clock), as well as a Clock heterozygote genetic control (F1) for comparison. All activity records are displayed double plotted on a 24 hr scale. Days of activity recording are indicated on the vertical axis. All mice in this study were exposed to an identical lighting schedule, which is encoded by the colored bar to the left: yellow represents LD 12:12, black represents DD, yellow arrows represent CT17–23 light pulses. Fourier analyses of circadian amplitude (relative power spectral density; rPSD), applied to the 20 days interval between the two light pulses, show a clear peak at one cycle/day for the WT and Clock/+ mice, but not in the arrhythmic Clock/Clock mouse. The peaks of the X2 periodogram analyses for the same interval identify the dominant circadian periods for the WT and Clock/+ mice; the Clock/Clock activity record lacks a detectable circadian periodicity.

