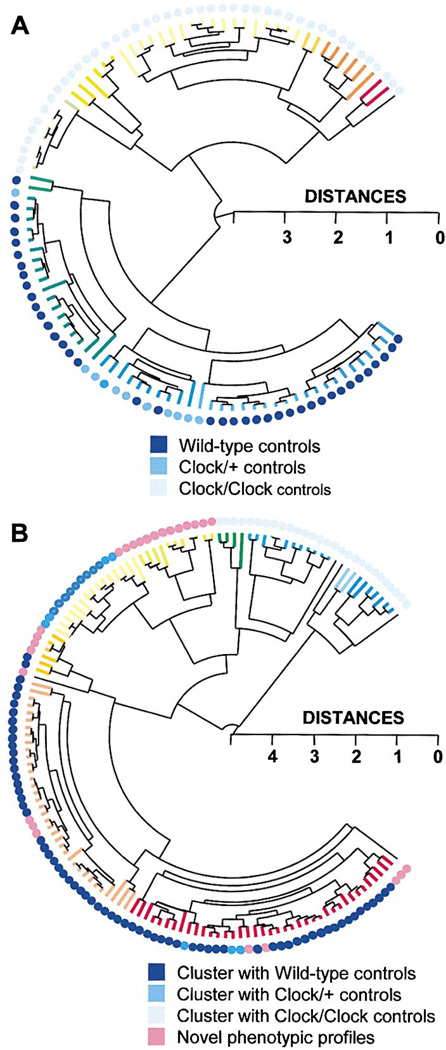
Figure 7. Cluster Analysis of Controls and Chimeras.
Complete linkage hierarchical cluster analysis was used, based on all 7 measures of circadian period and amplitude in DD: TAUDD1A, TAUDD1B, TAUDD2, TAUDD3, TAUDD4, FFTDD1, FFTDD4 (in the cluster tree, branch color changes by 0.25 distance metric length of terminal nodes).
(A) Cluster analysis performed on control groups demonstrates the effectiveness of the procedure for sorting multidimensional behavioral phenotypes. The Clock genotypes of the control mice are indicated by the colored dots. The appearance of the cluster of Clock/+ controls amidst the WT controls is an artifact of the way the statistical program positioned the branches of the dendrogram (at each bifurcation of the dendrogram, the position of the clusters can be reversed).
(B) Novel and Clock/+-like phenotypes are quantitatively detected among Clock/Clock chimeras using cluster analysis. The colored dots indicate the control genotype with which each chimera clustered most closely (within a 0.5 distance metric, in a separate cluster analysis combining chimeras and controls).

